3PG mix output sum #20
Description
@checcomi I had run the test for the 3PGMix. If I understood correctly, in the output, sum of 3 layers (e.g. Basal area) shall give the same result as if I would run the single site version. However the output very different. E.g . the BasalArea sum gives 3 times higher level.
firstRun <- r3pgn(siteData = data_site[1,],
  climate = data_climate,
  parameters = data_param[,2],
  outputs = c(1:5, 10:12, 26:27))


data_siteMix$minAsw <- 30
firstRunMix <- r3pgnMix(siteData = data_siteMix,
  climate = data_climate[,,1],
  parameters = data_paramMix,
  outputs = c(1:5, 10:12, 26:27))


i <- 4
plot(firstRunMix$output[,i,1] +firstRunMix$output[,i,2]+firstRunMix$output[,i,3])
points(firstRun$output[,i,1],pch=20,col=2)
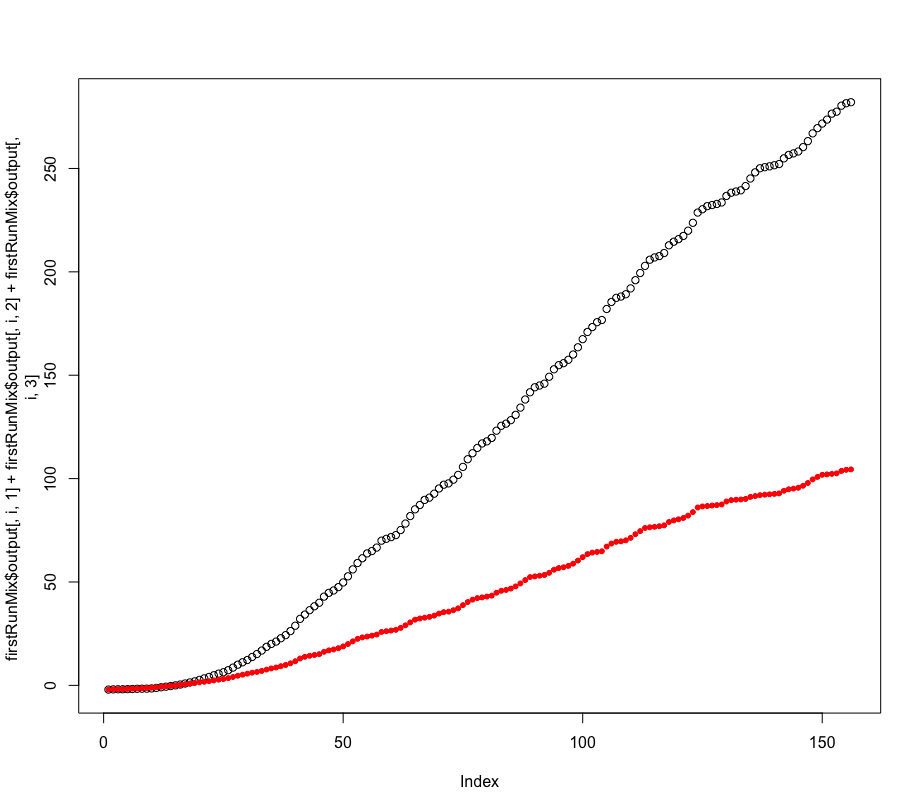
The output of the r3pgn is rather similar to one layer output of r3pgnMix
plot(firstRunMix$output[,i,1] )
points(firstRun$output[,i,1],pch=20,col=2)
