Skip to content

visualMap折线区间段颜色混淆 #12361

@Torrie-Leung

Description

@Torrie-Leung

Version

4.7.0

Steps to reproduce

visualMap:{
          show:false,
          dimension: 1,
          pieces: [
            
            {gte:-10,lte:0,color:'#8bc34a'},
            {gt:0,lte:20,color:'#ff5722'},
            
          ]
        },

What is expected?

在值为大于-10小于等于0的区间,折线应该显示为绿色

What is actually happening?

mixedColor

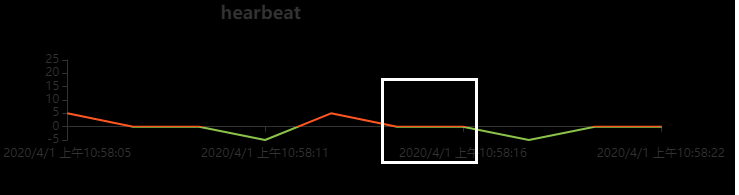
实际上在值为0时折线颜色是红色和绿色重叠混合的色值
使用{value: 0,color:'#8bc34a'}指定特定值的颜色也不起效

Metadata

Metadata

Assignees

No one assigned

    Labels

    bugpendingWe are not sure about whether this is a bug/new feature.

    Type

    No type

    Projects

    No projects

    Relationships

    None yet

    Development

    No branches or pull requests

    Issue actions