-
Notifications
You must be signed in to change notification settings - Fork 17
Node Utilization Graph
impetus-opensource edited this page Jan 7, 2015
·
1 revision
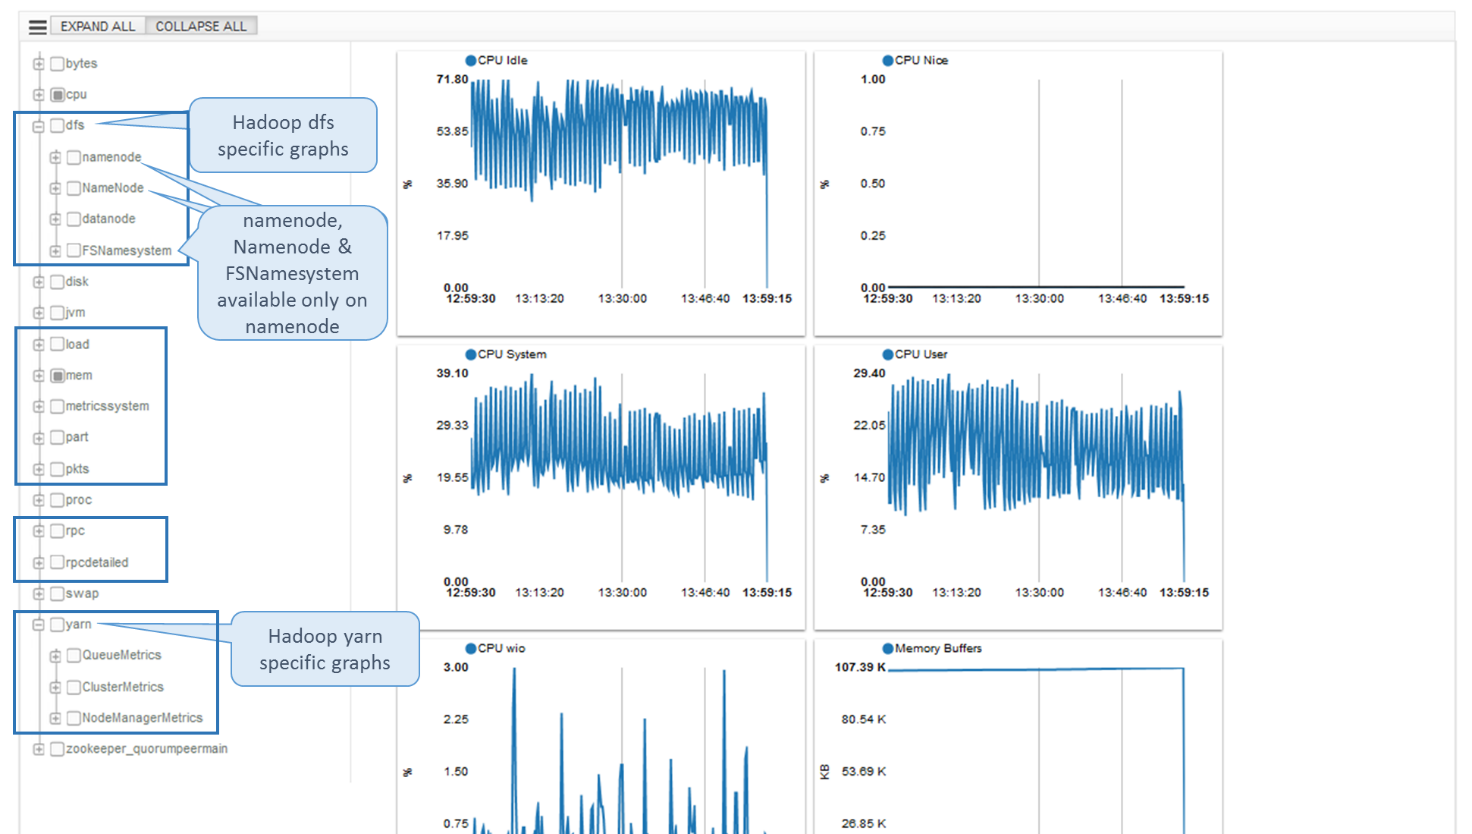
Node utilization graphs can be accessed through “UTILIZATION GRAPHS >” link on Node Details page. A screenshot of Hadoop 2 node utilization graph page is as shown below. The user can view the trend cumulatively for last one hour, or one day, or one week, or one month or one year. Accordingly the utilization graphs are drawn.
![] (https://raw.githubusercontent.com/wiki/impetus-opensource/ankush/images/hadoop/Image27.png) Figure 27: Node Utilization Graph
-
Ankush at a Glance
-
Installing Ankush
- Start Using Ankush
-
First Time Interaction
-
Regular Interaction
- Understanding Ankush Navigation
-
Cluster Creation
- General Details
- Java
- Working With Nodes
- Agent Directory
- Configuring Vendor & Version
- Configuring Technology Specific Details
- Deploy Mode - Configuration
- Deploy Mode - Map Nodes
- Register Mode - Configuration
- Saving Details as a Cluster Creation Template
- Deploying Cluster
- Tracking Cluster Deployment Progress
-
Redeploying Cluster with Deployment Error
- Cluster Management
- Cluster Monitoring
-
Tiles Summary
-
Glossary