A visualization aiming to help exploring Google's cluster manager Borg's dataset
The visualization includes:
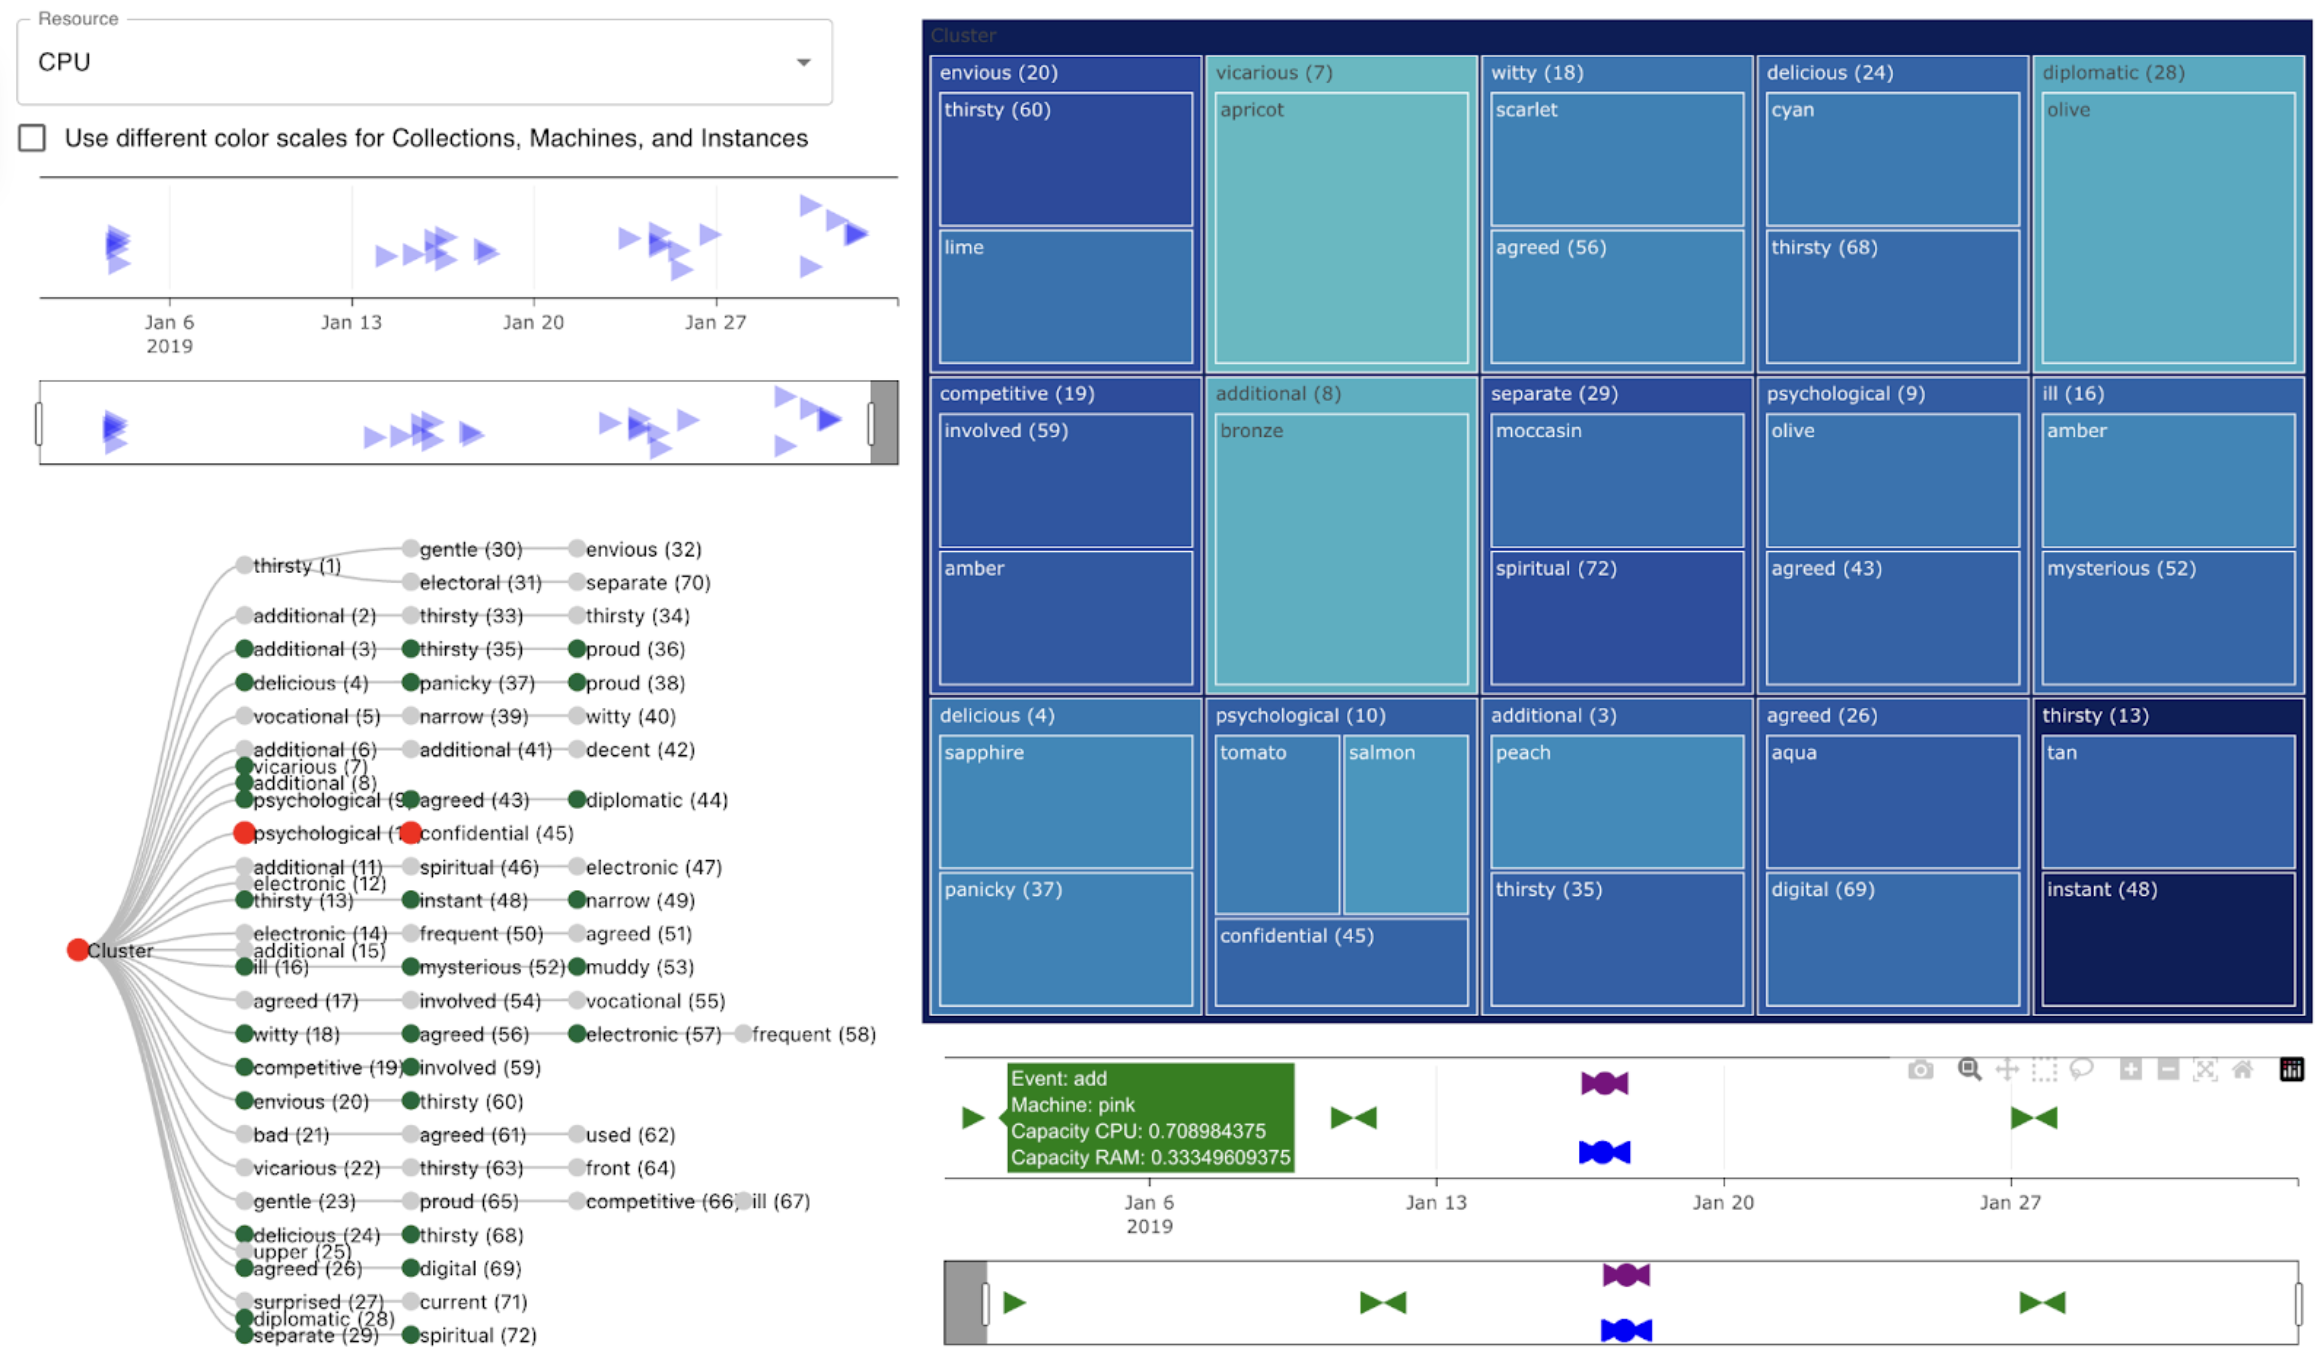
- Filters by date (the date is mocked for readibility)
- A TreeMap with resources per job/machine/instance
- A Tree Graph to help navigate the parent-child relationships between jobs
- An event timeline to help explore events for a selected job/machine/instance