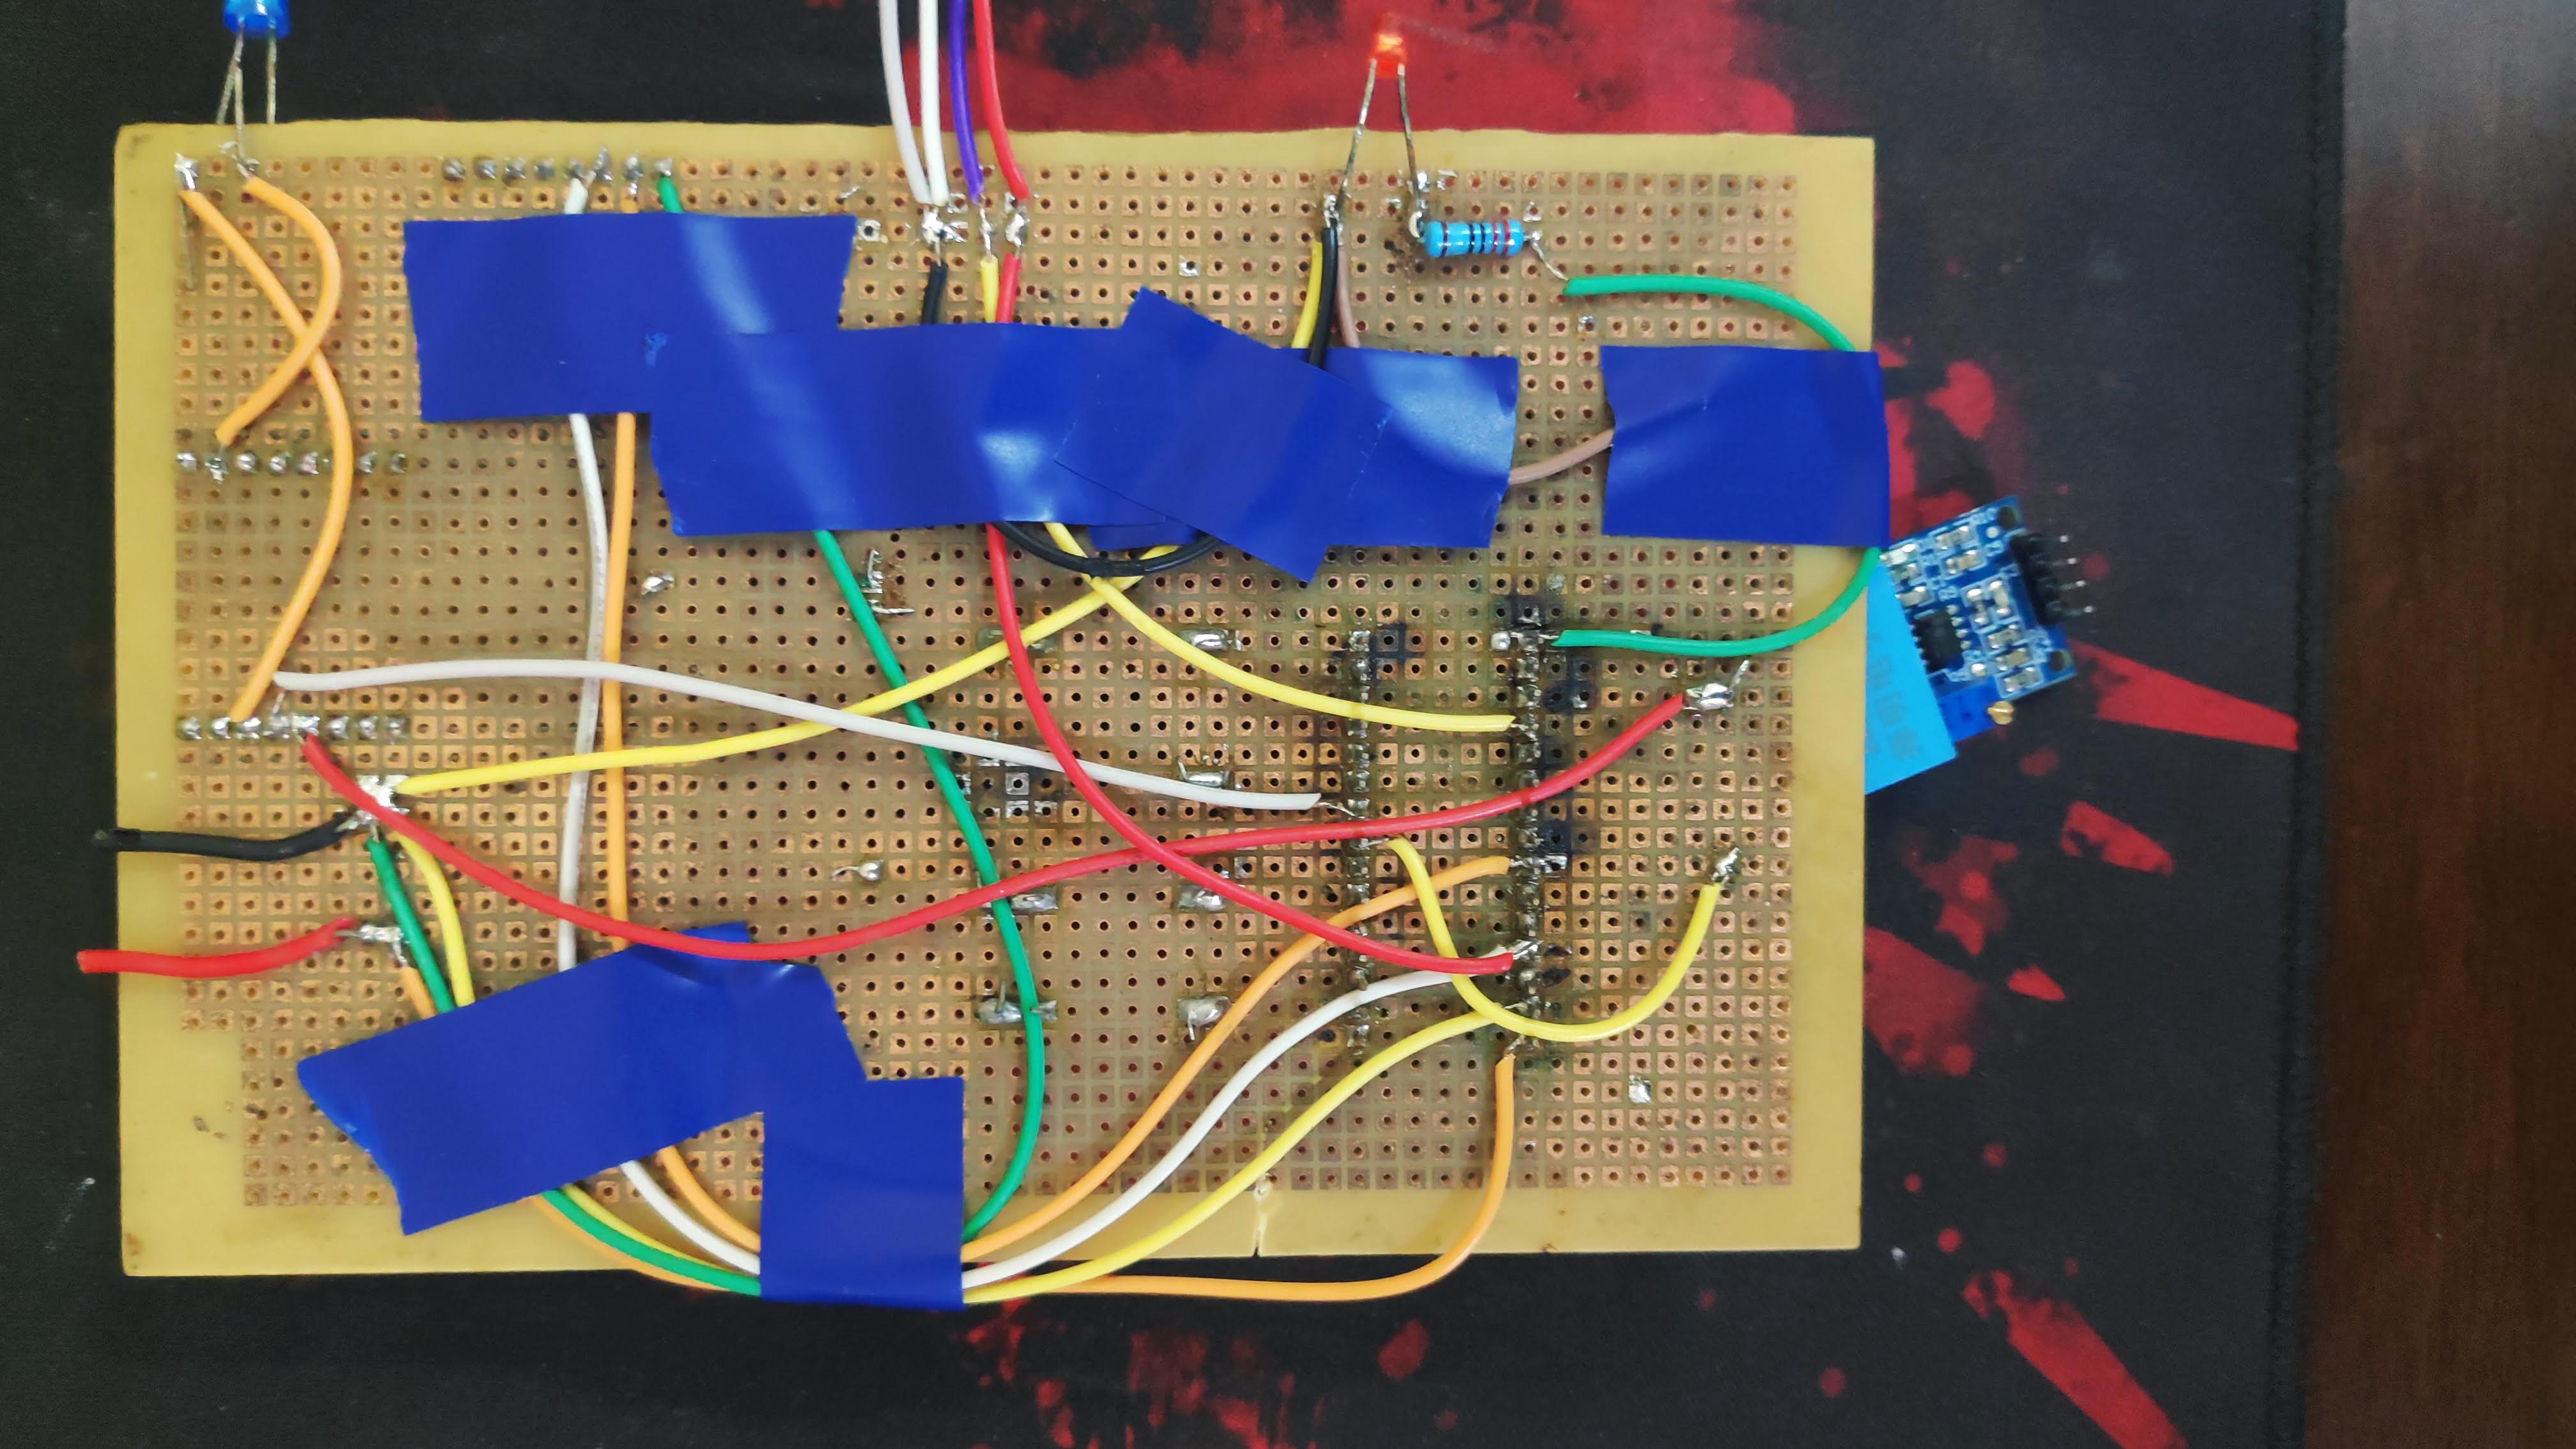
Smart alternative to traditional energy meters currently in use. First prototype, a lot of work is to be done. Initial prototype is successful and works accurately for resistive loads. Project Video
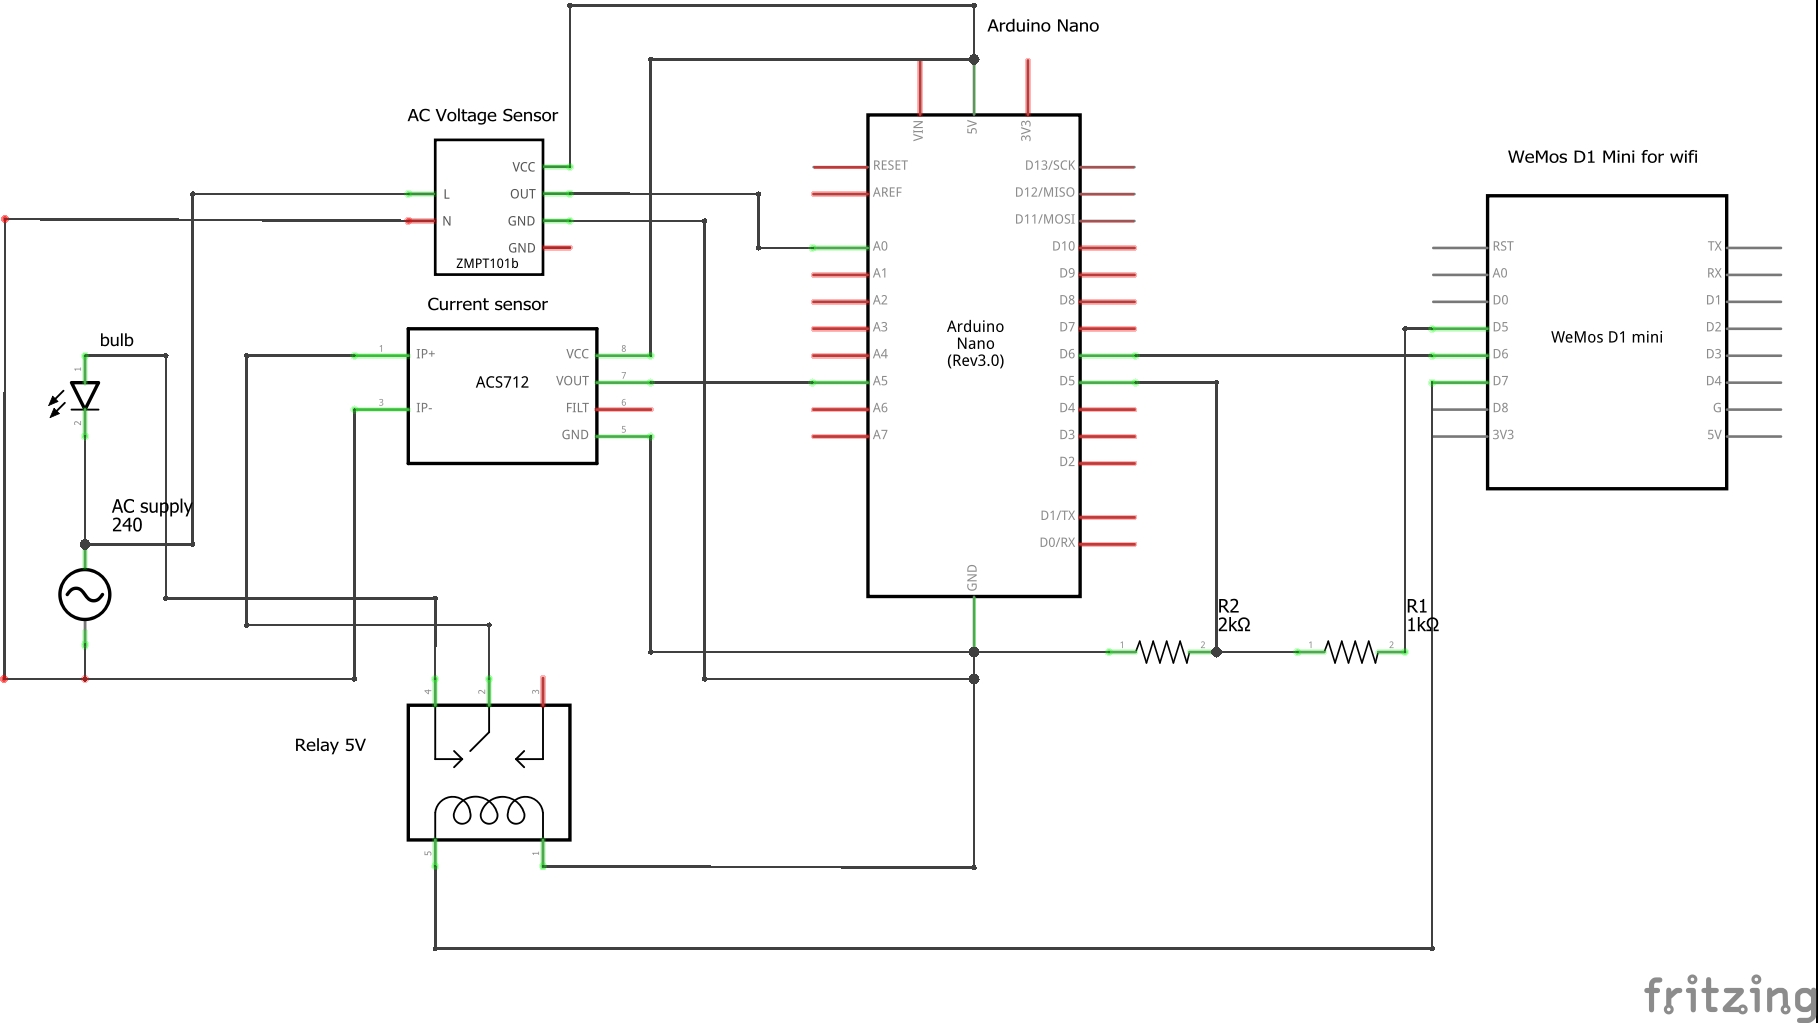
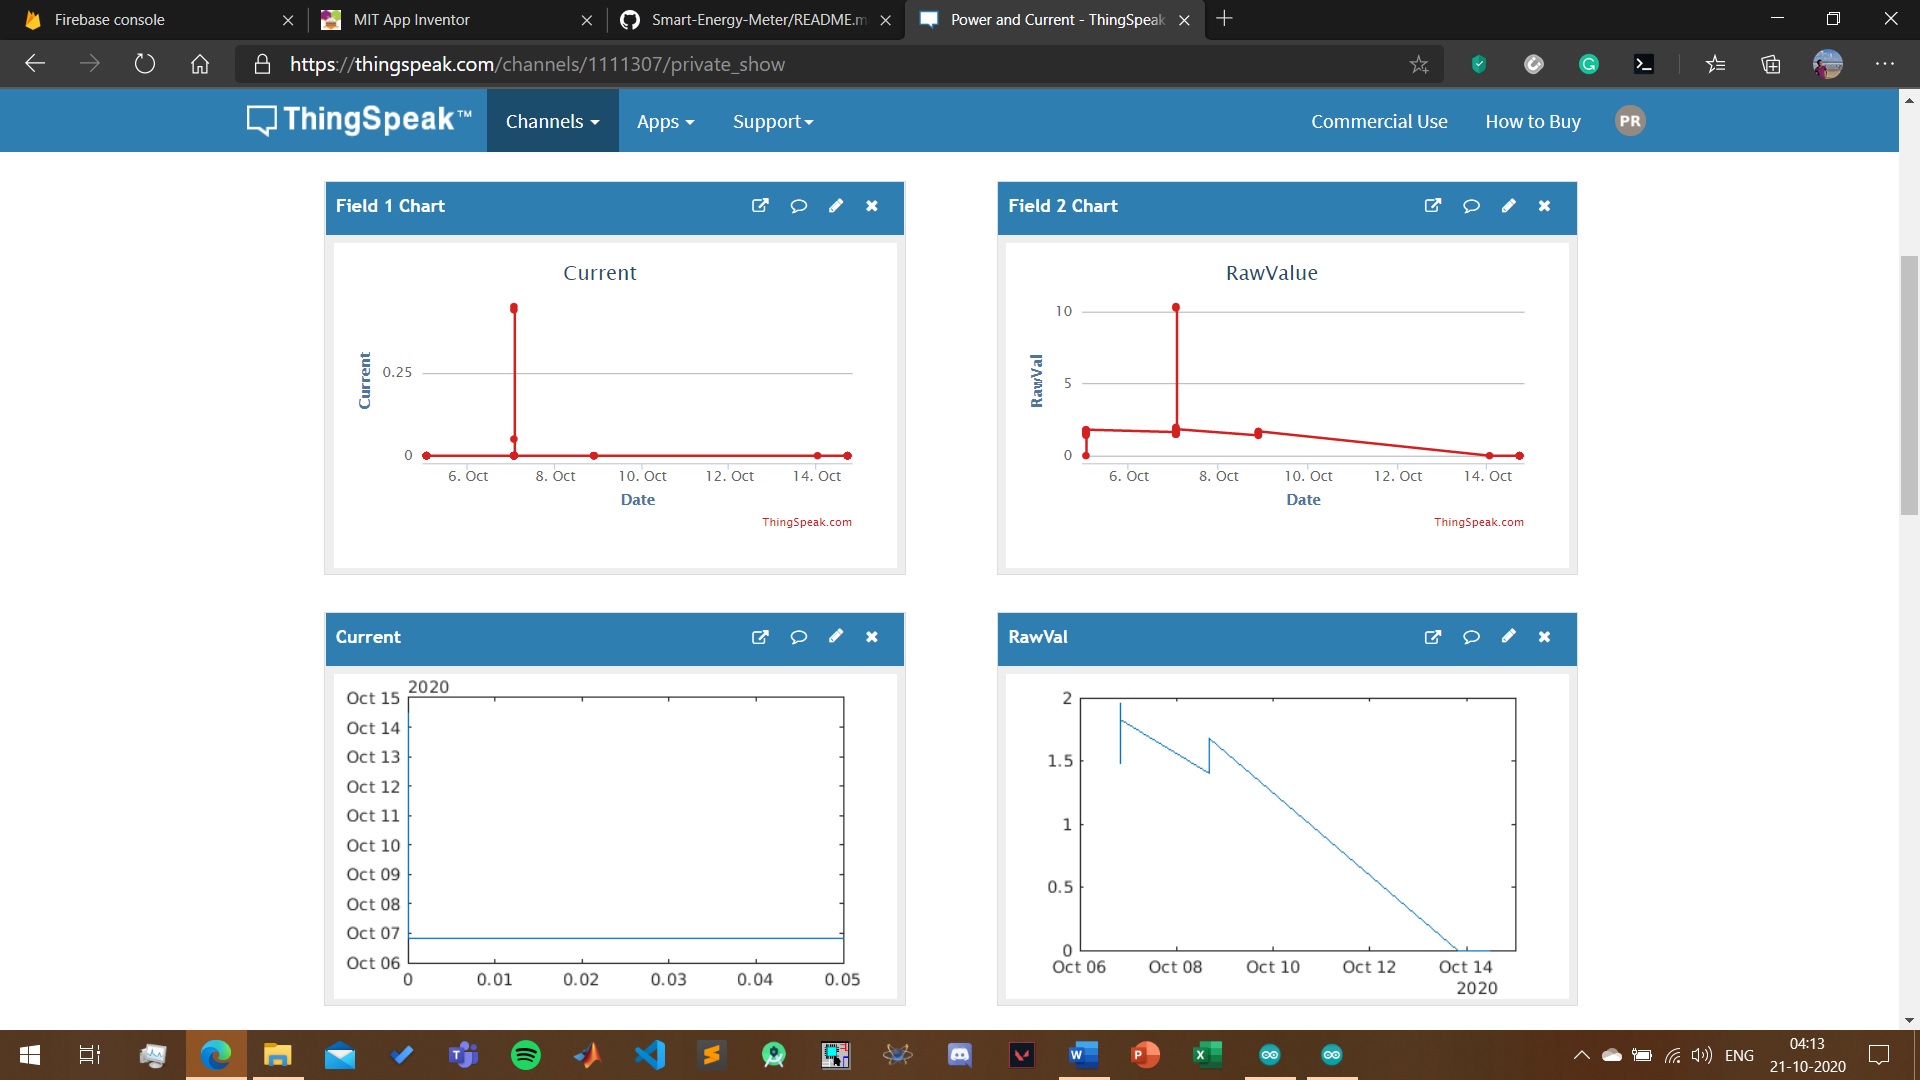
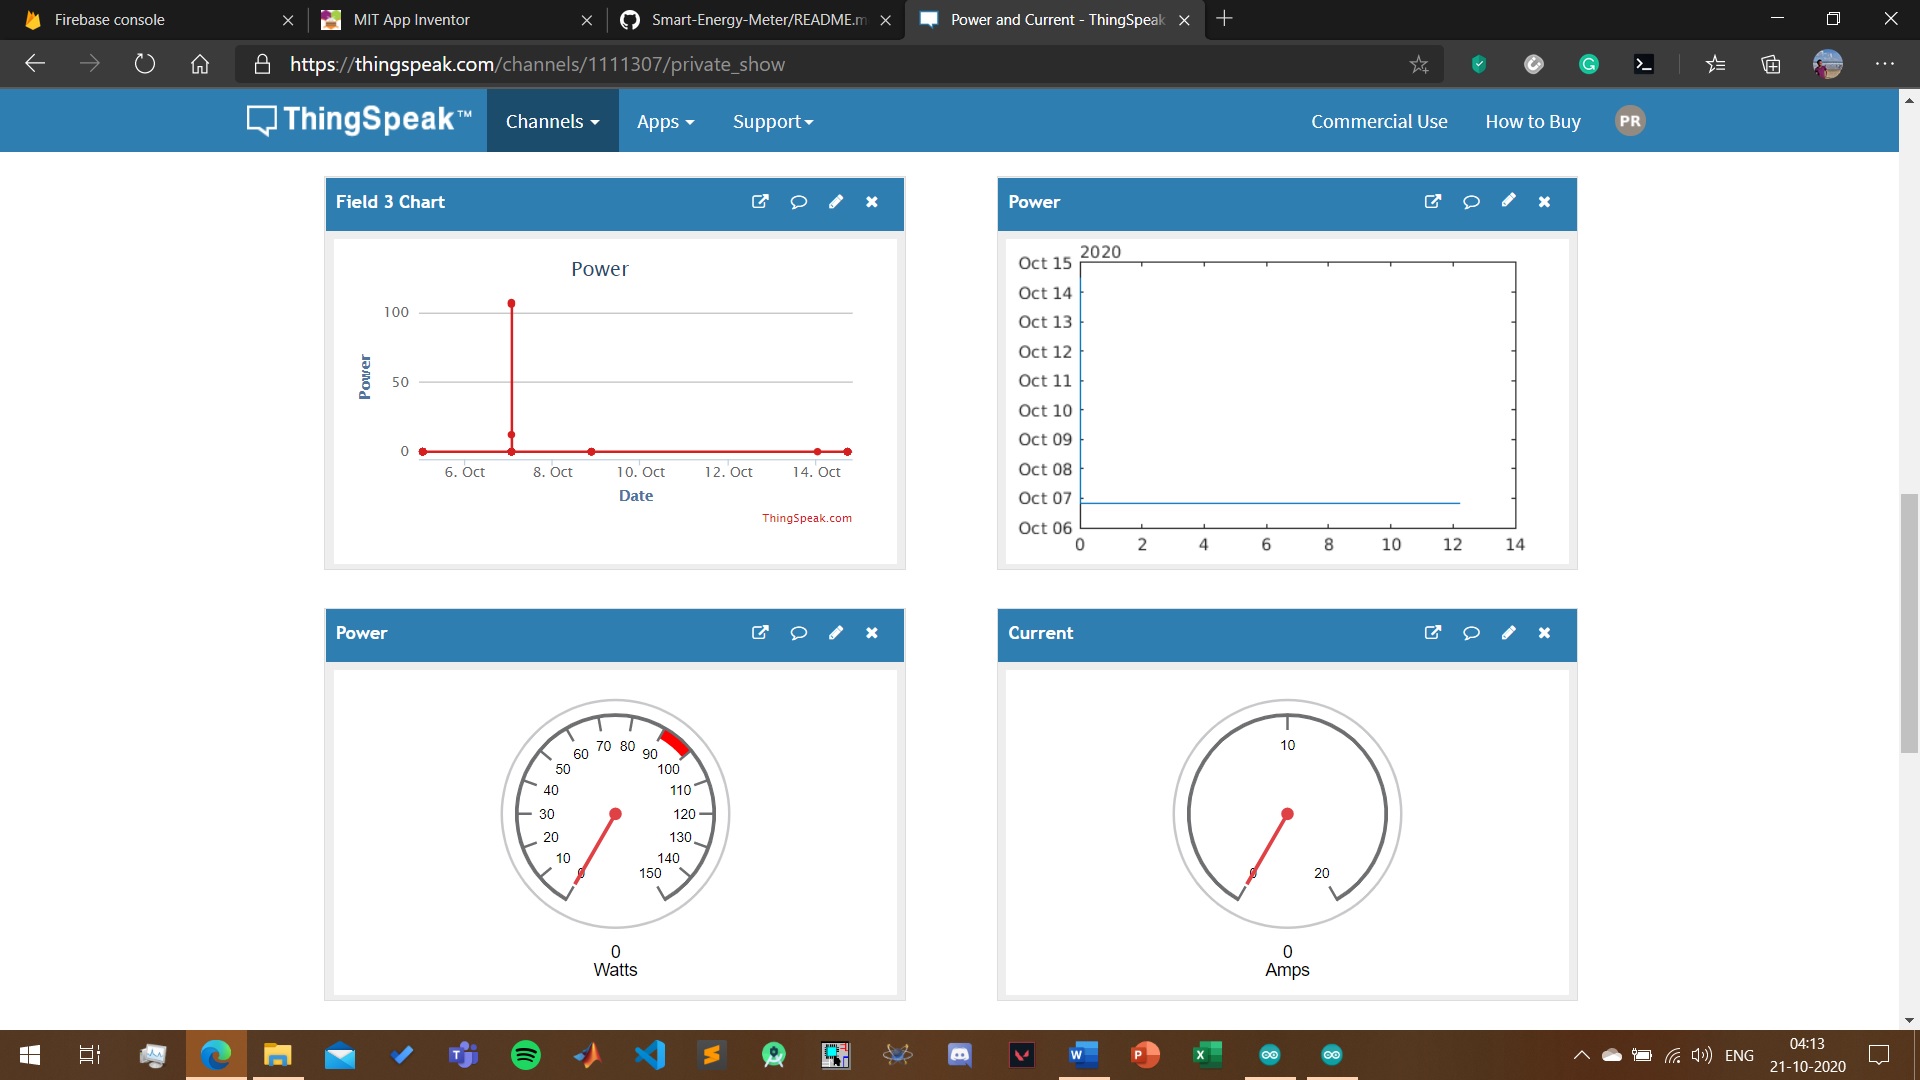
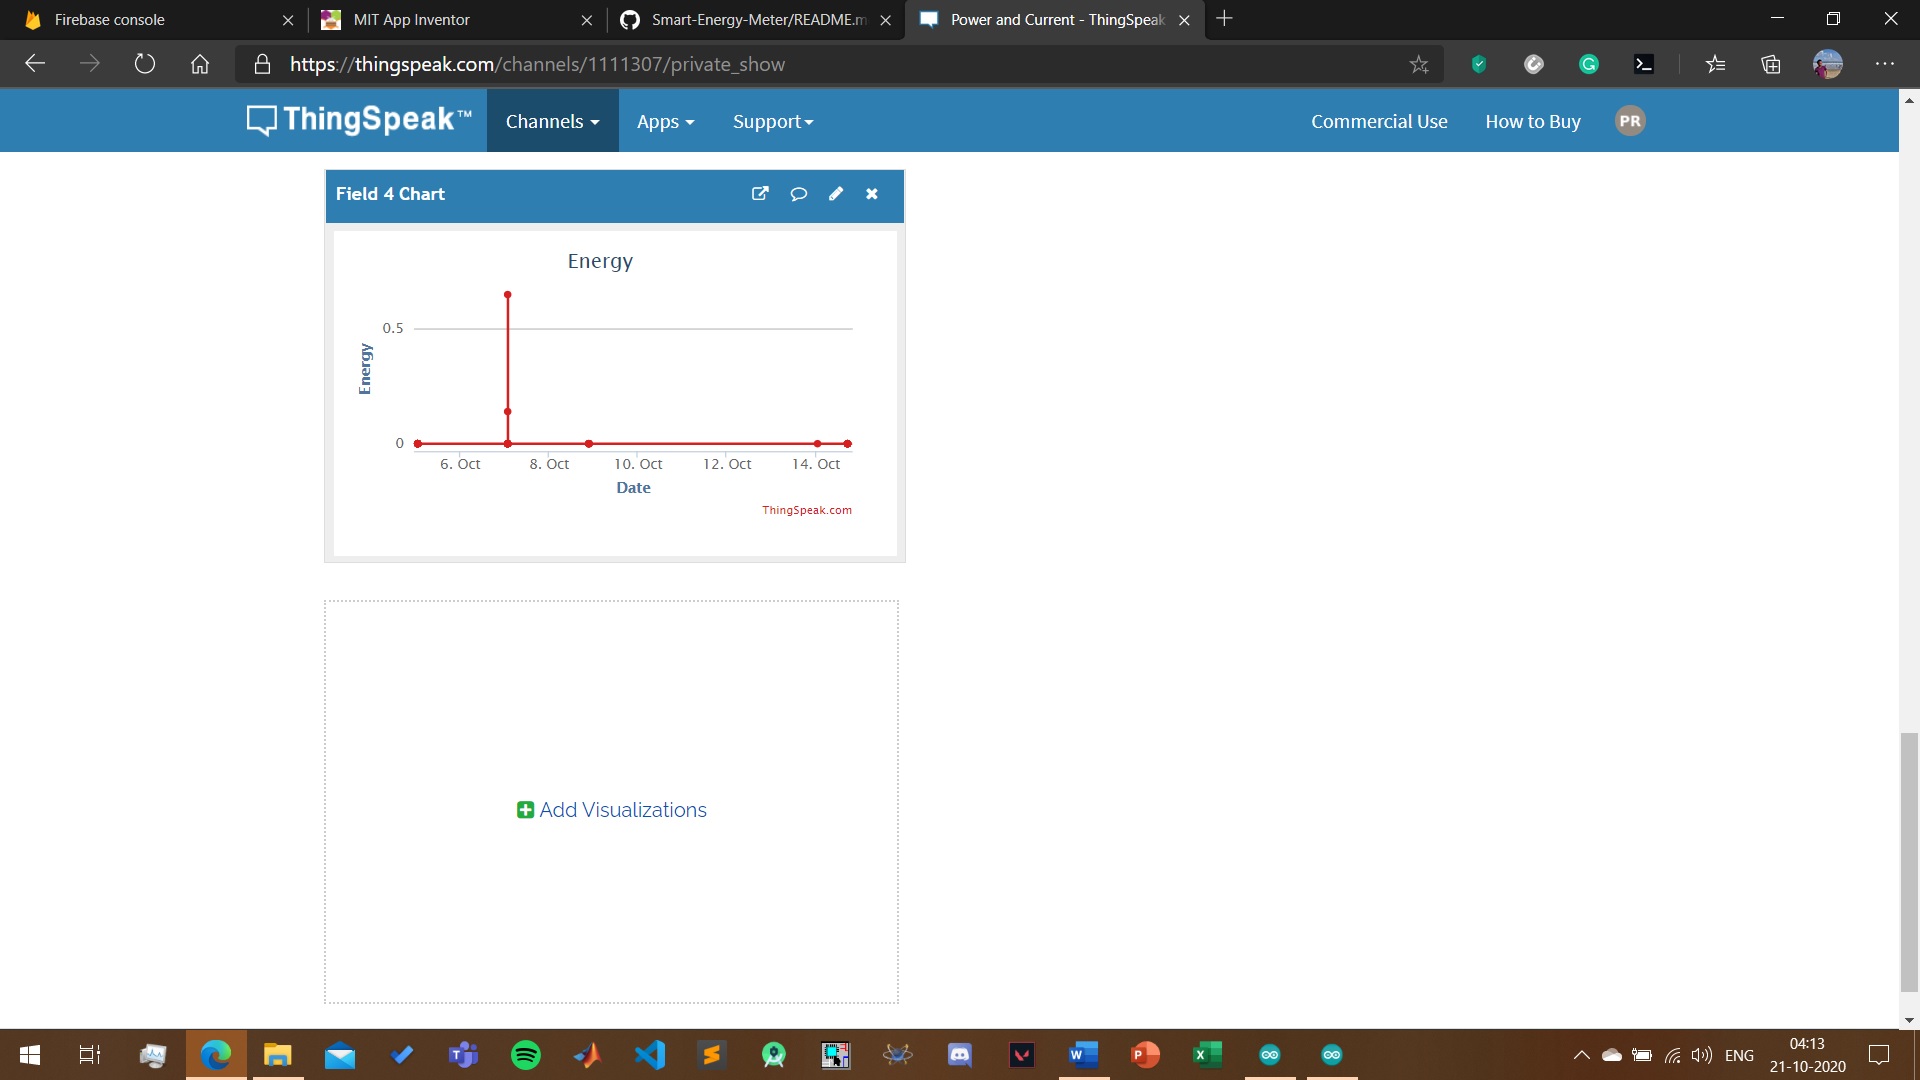
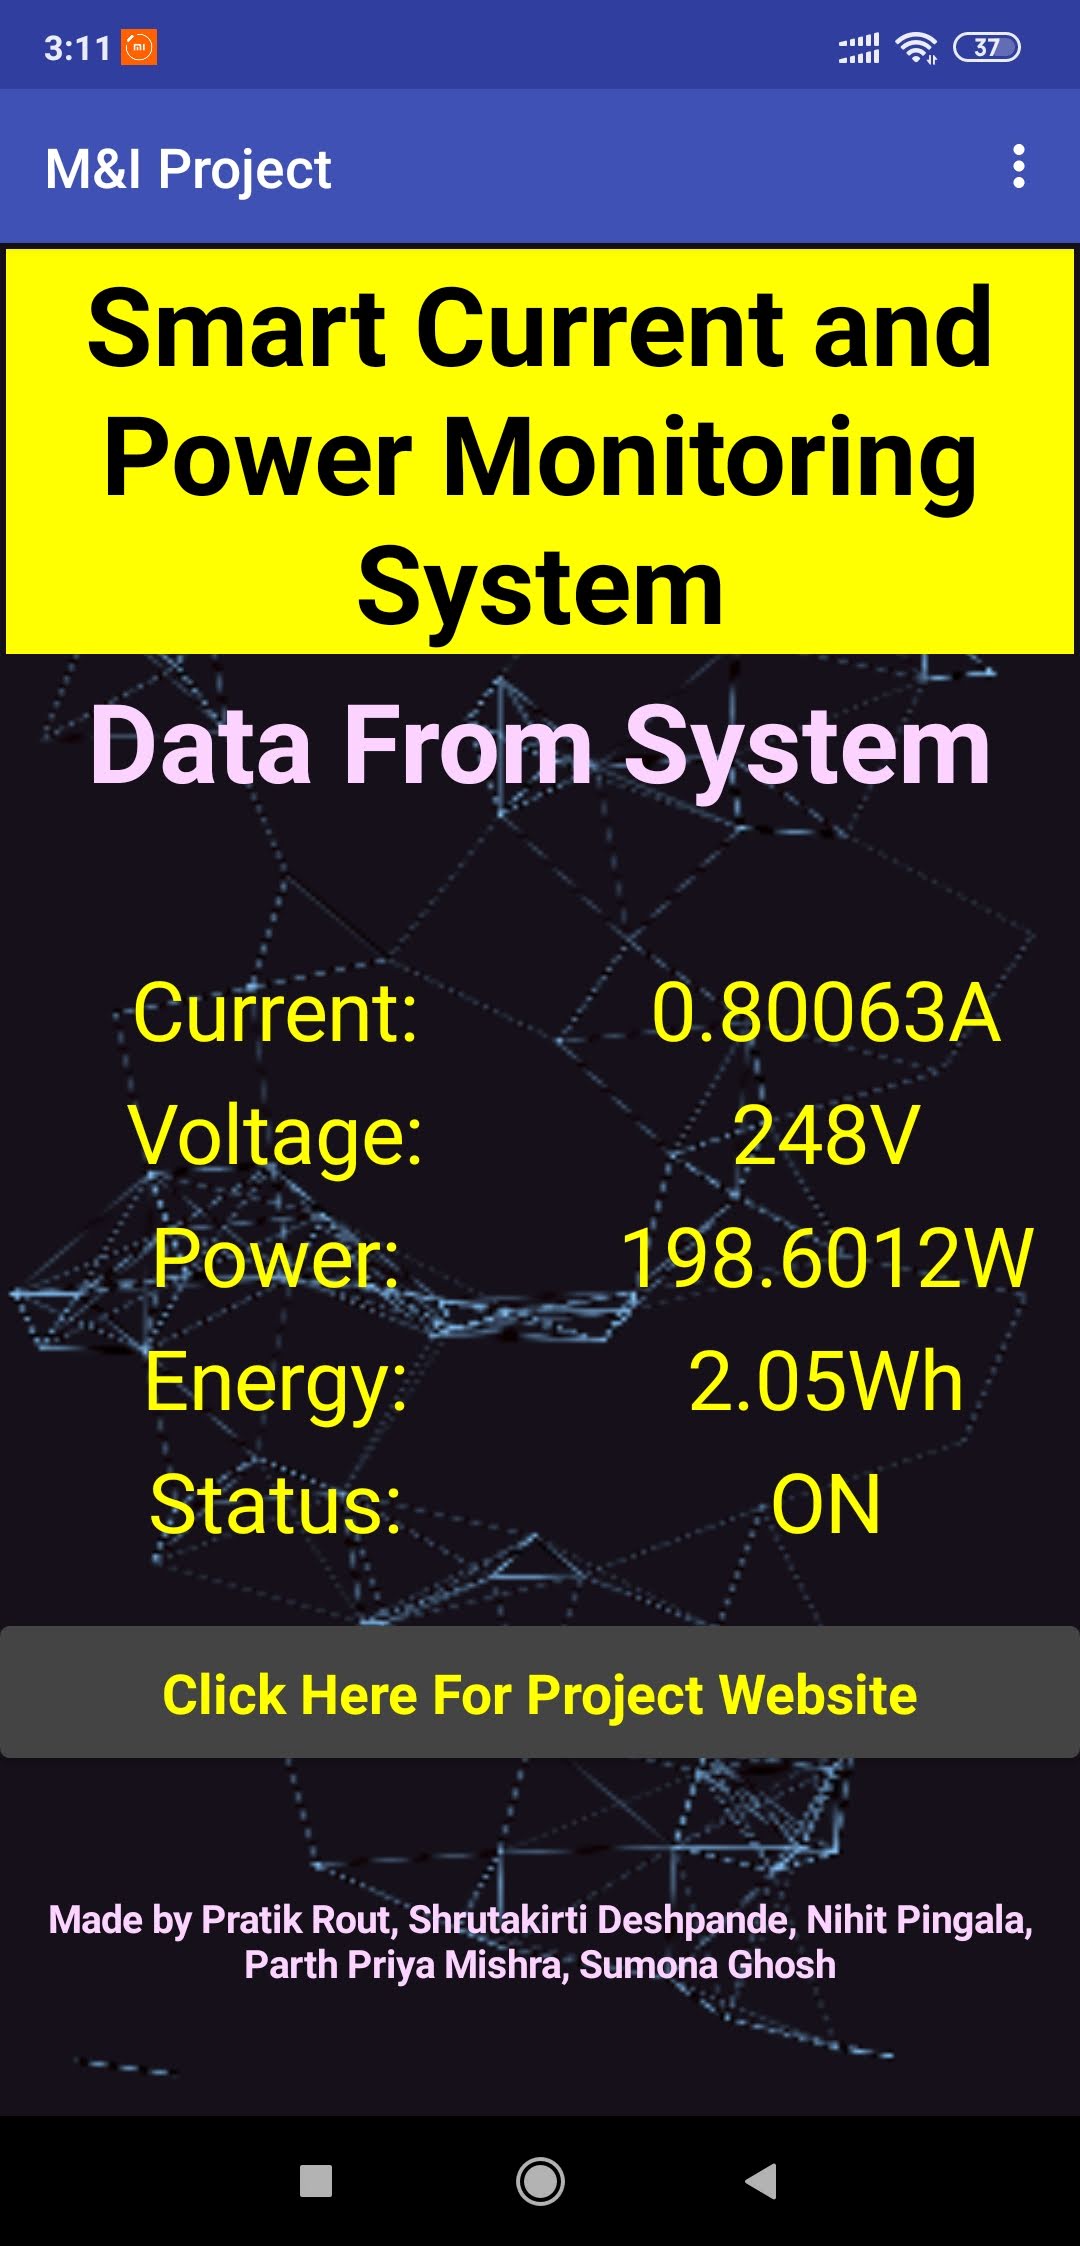
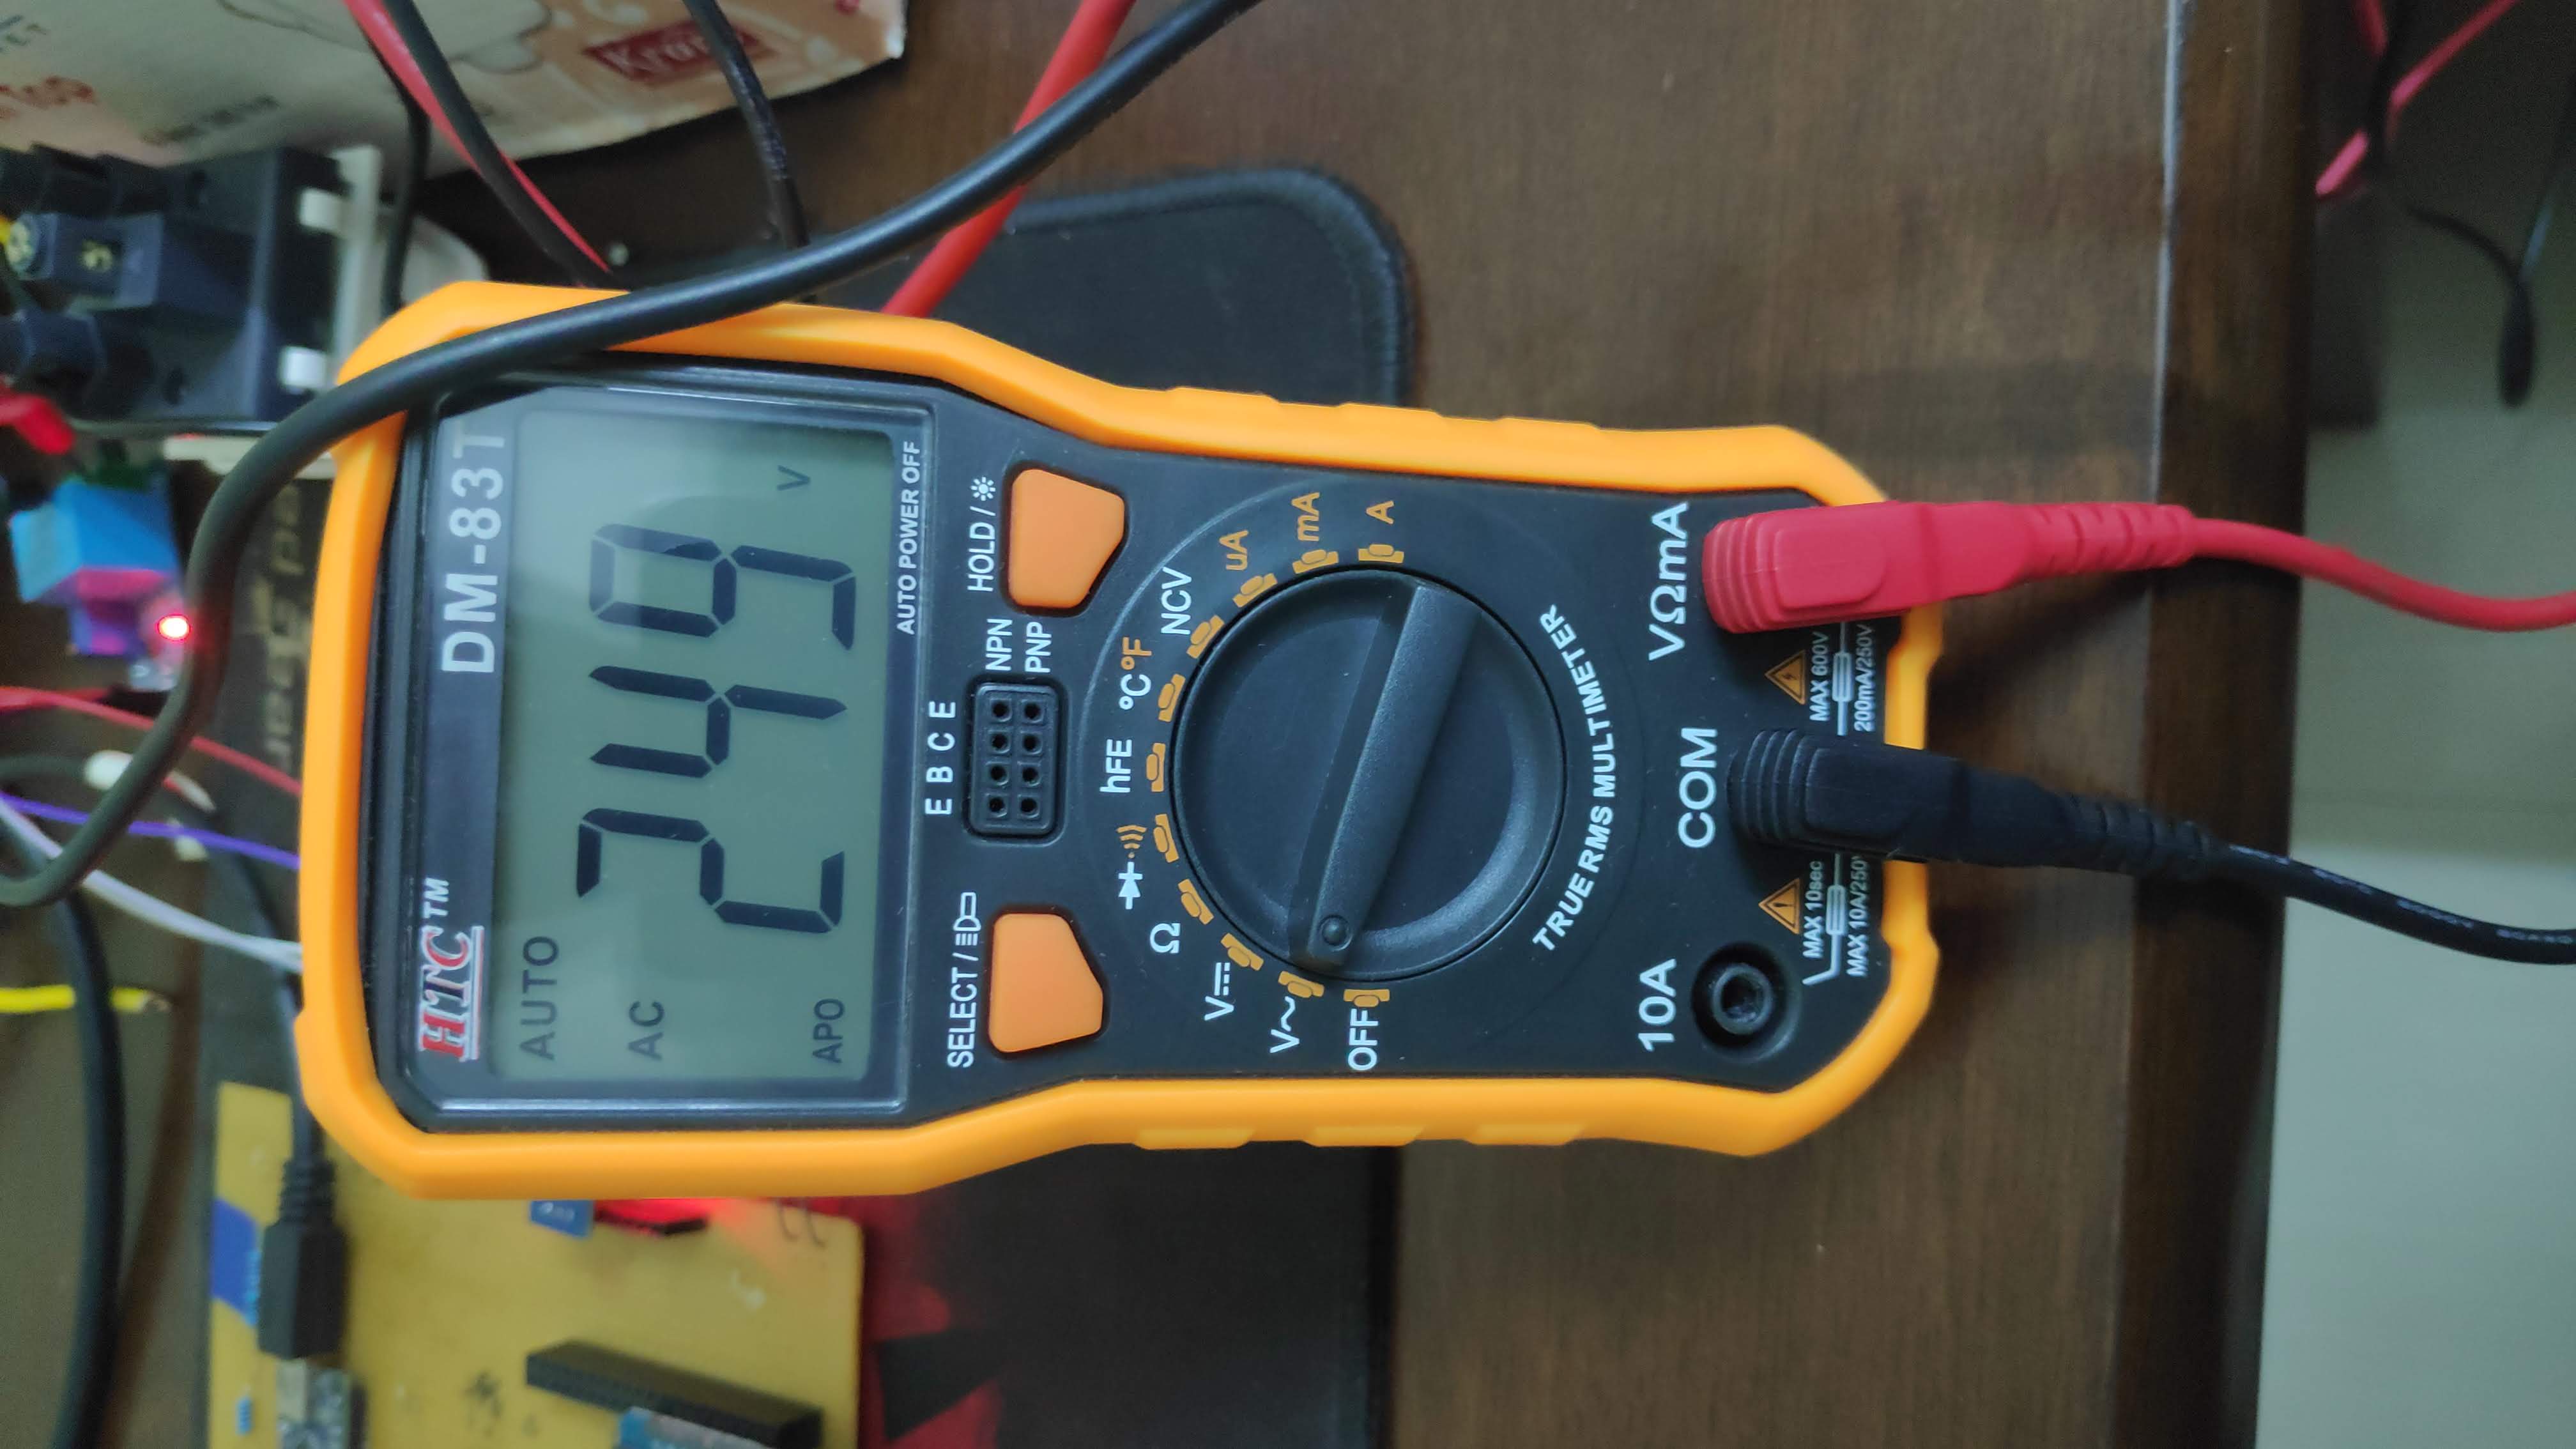
Measurement of AC/DC current drawn and power consumed by devices using ACS712 sensor and Arduino nano and calculating the energy used during operation by recording the time for which the device was working, with remote on/off capabilities. For AC - power can be measured easily once current is calculated since normal household supply voltage in the sockets is 220V - 240V(here we are using ZMPT101B voltage sensor sensor for accurate meausrement). For DC we will use a voltage divider circuit using resistors or a voltage sensor connected to the Arduino analog pin to measure the voltage. Then we will send the measured data to a smartphone and a website(thingspeak.com) over WIFI and internet. Visualization of the recorded data will be in the form of graphs and numeric displays on the website(thingspeak.com) using MATLAB analytics. Data will also be displayed on an LCD screen connected to the circuit. The data can also be recorded in excel sheet using MATLAB analytics, after it is sent to the website.
Can be used in DC machines to monitor the power generated/used and current drawn in real time and diagnose any fault happening during operation of the machine. In solar panels to monitor the power generated, the incoming voltage and current. In homes we can measure the ac current drawn and power consumed by appliances. Can also be used as smart over-current protection device. Smart alternative to traditional energy meters
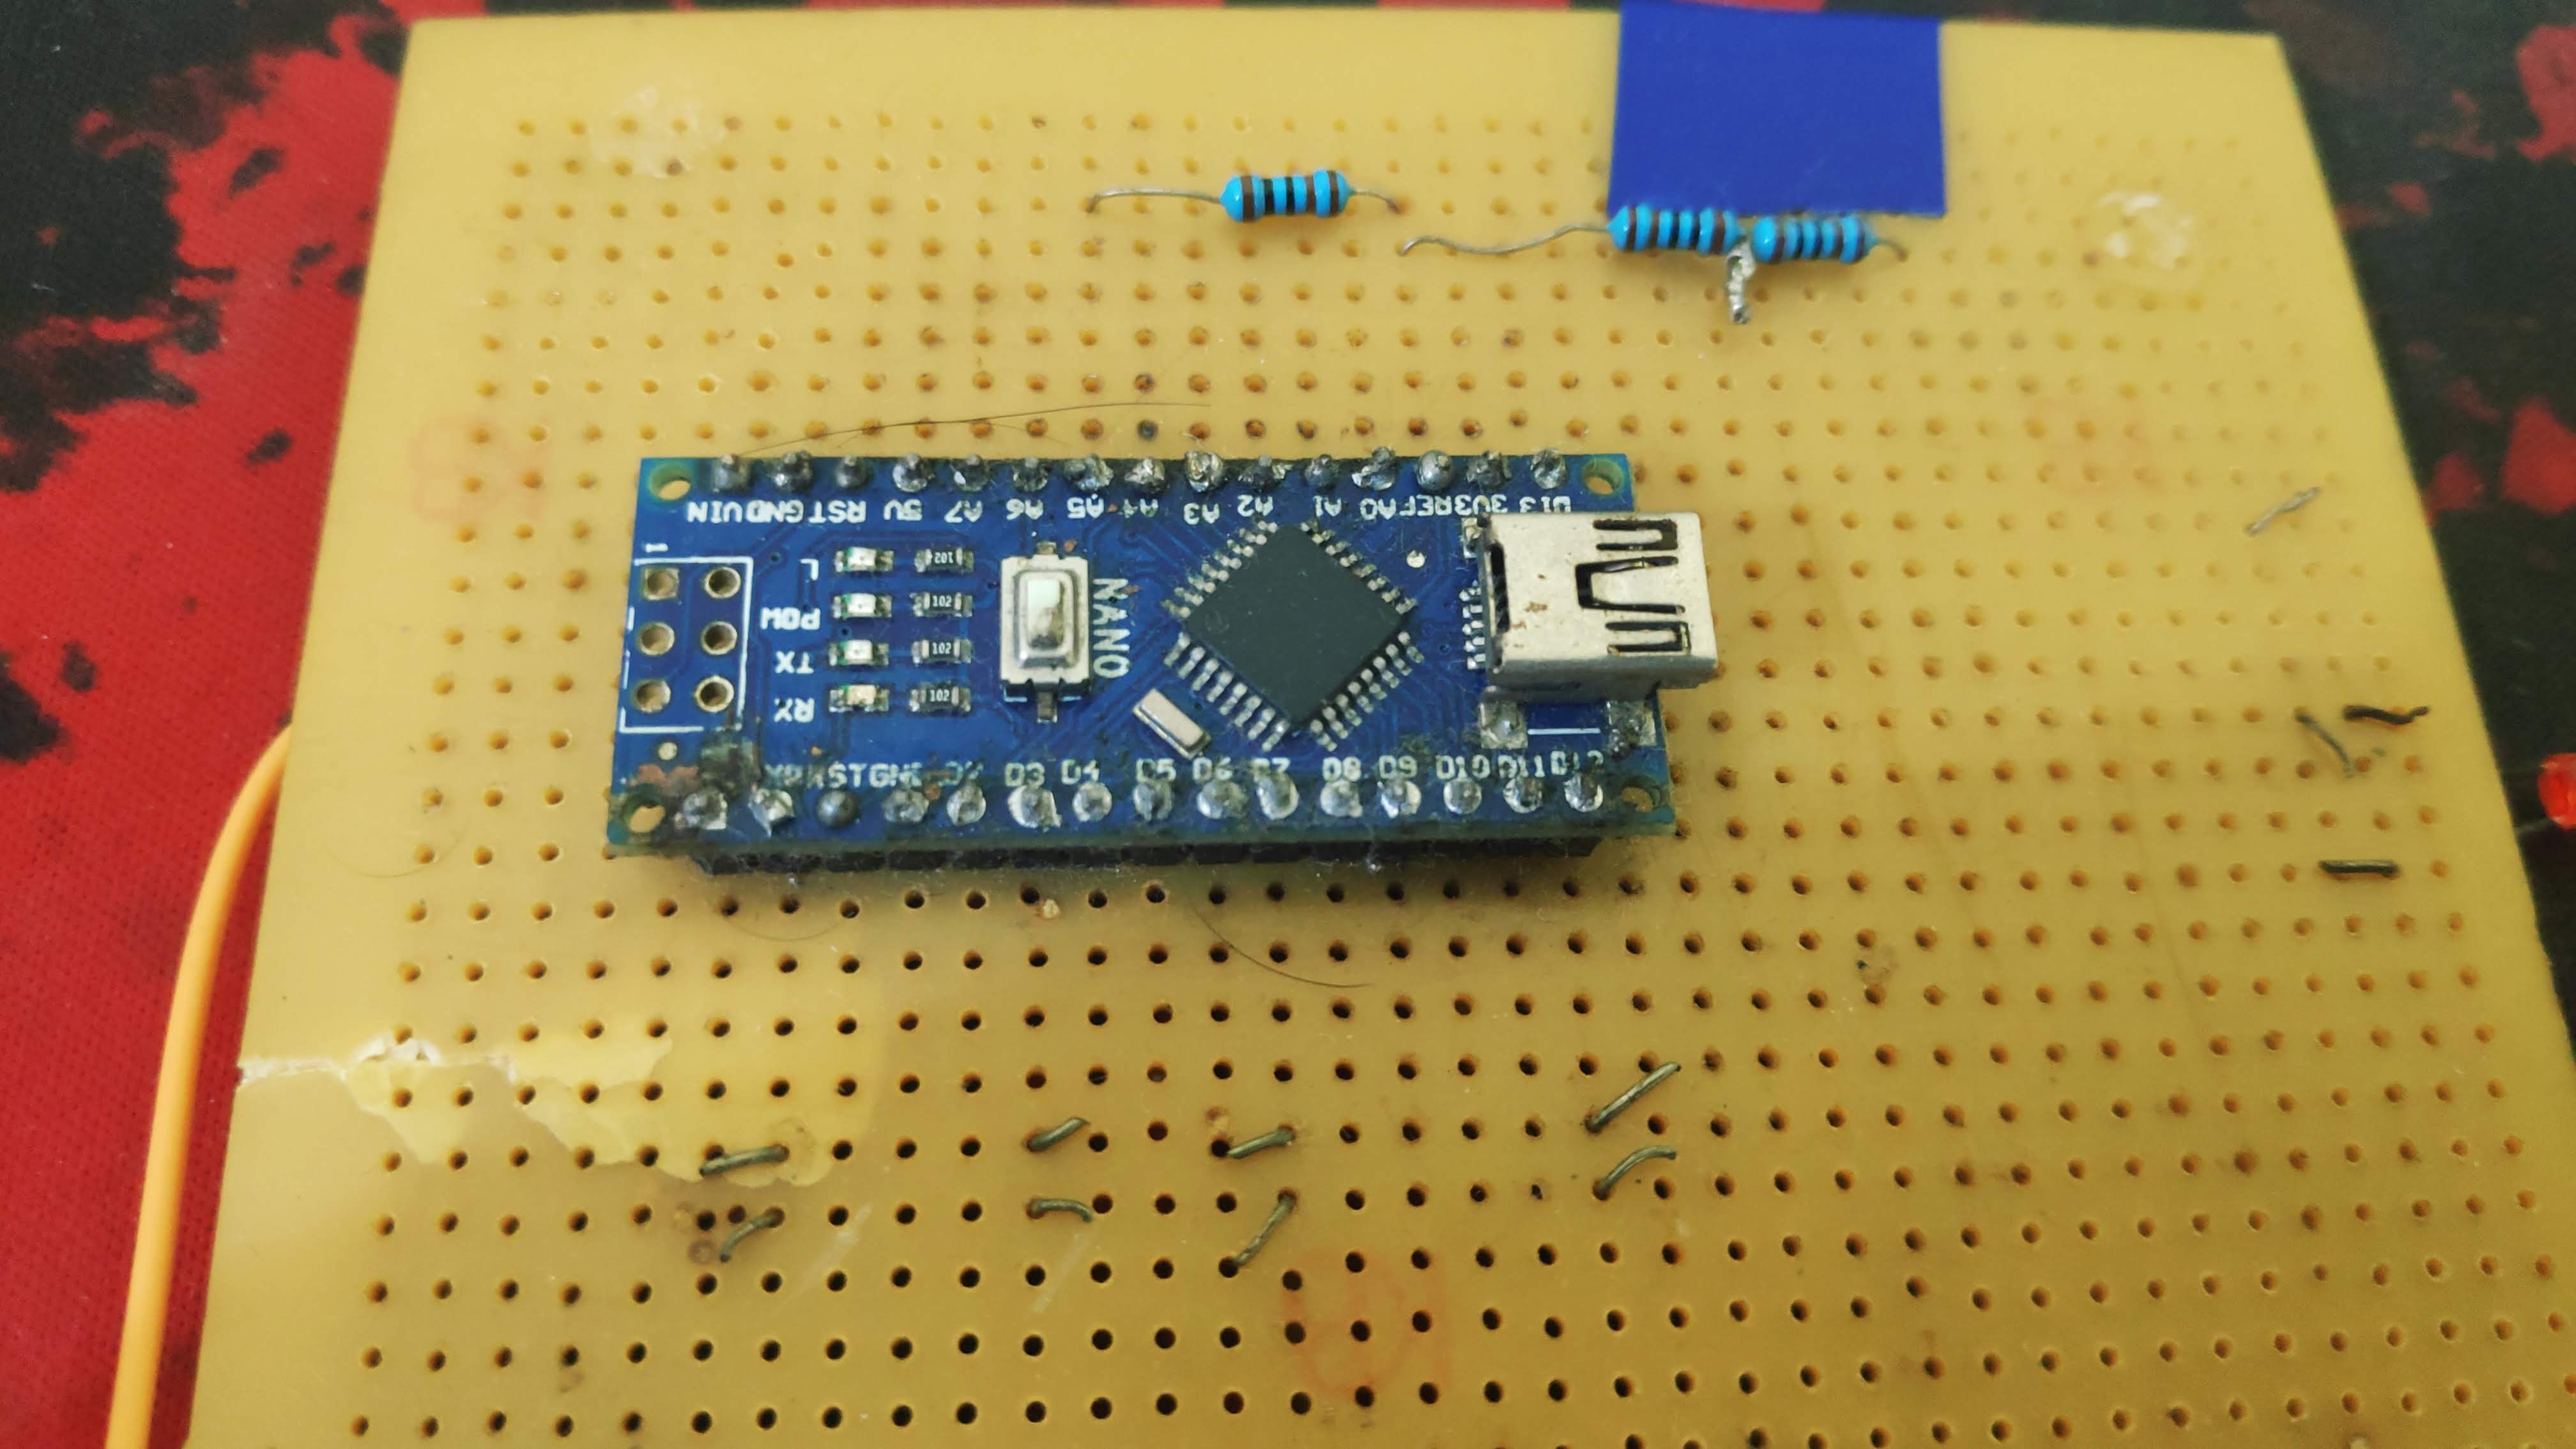
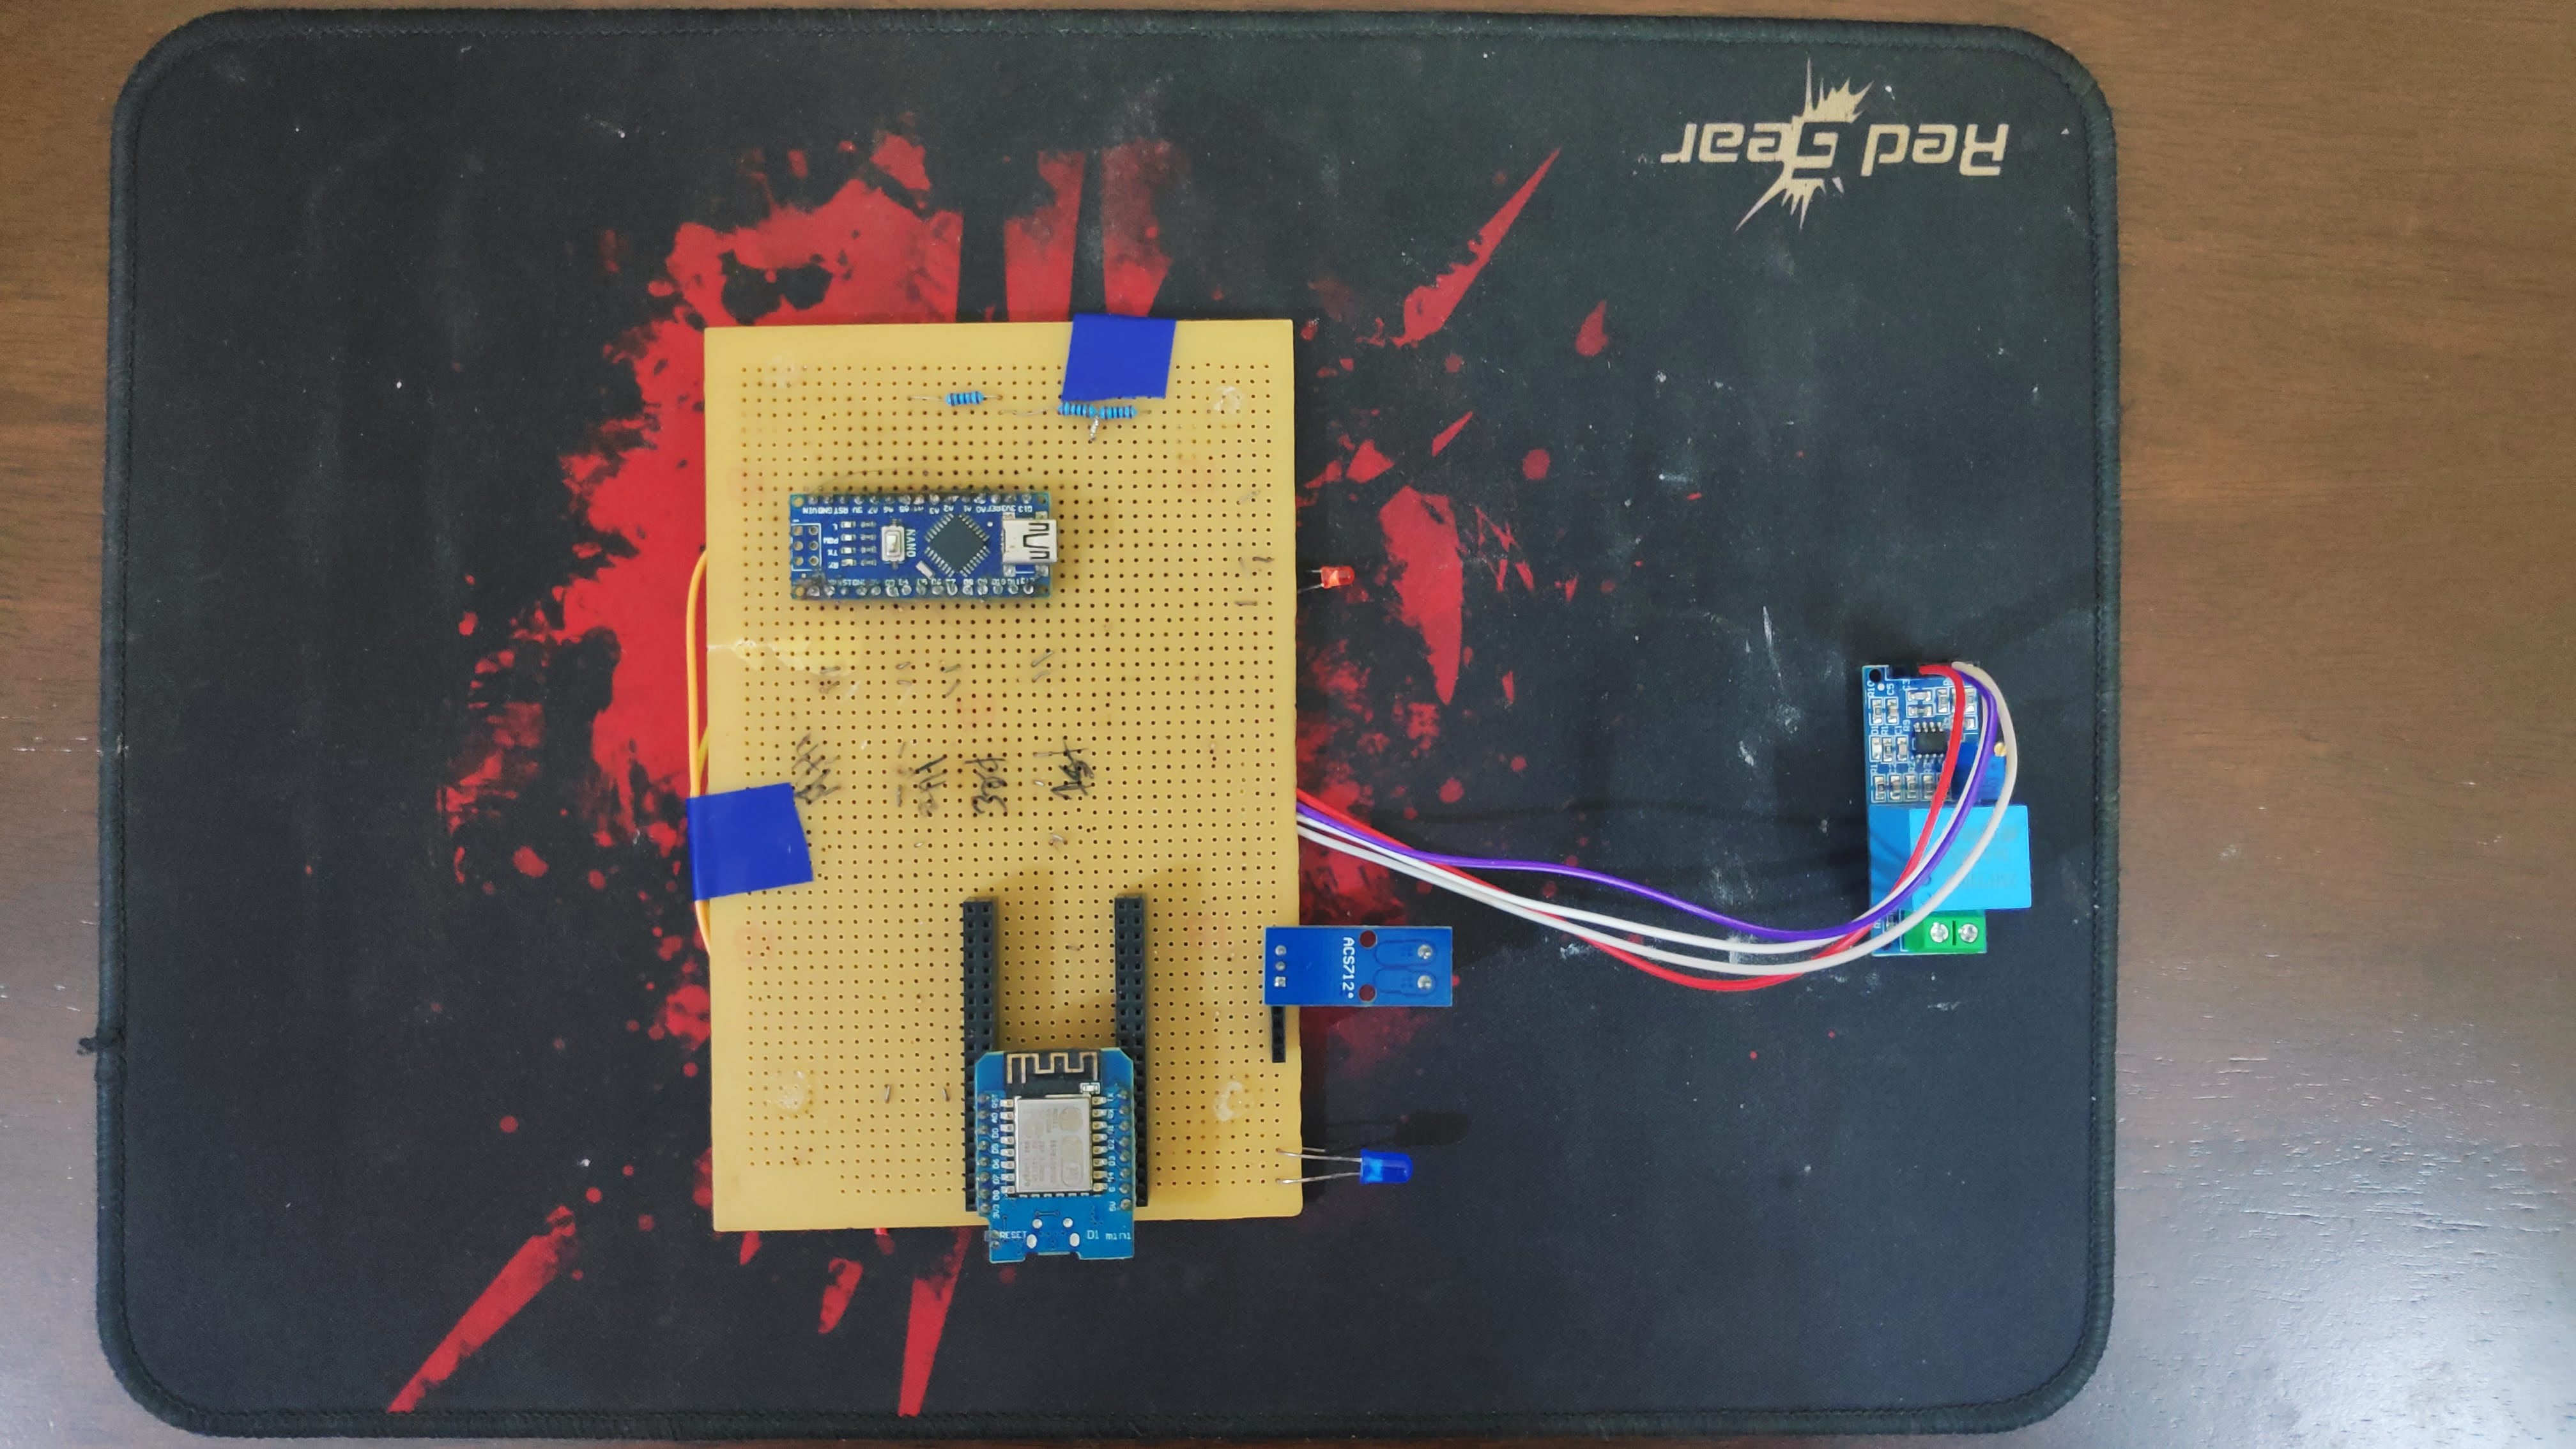
- Arduino Nano
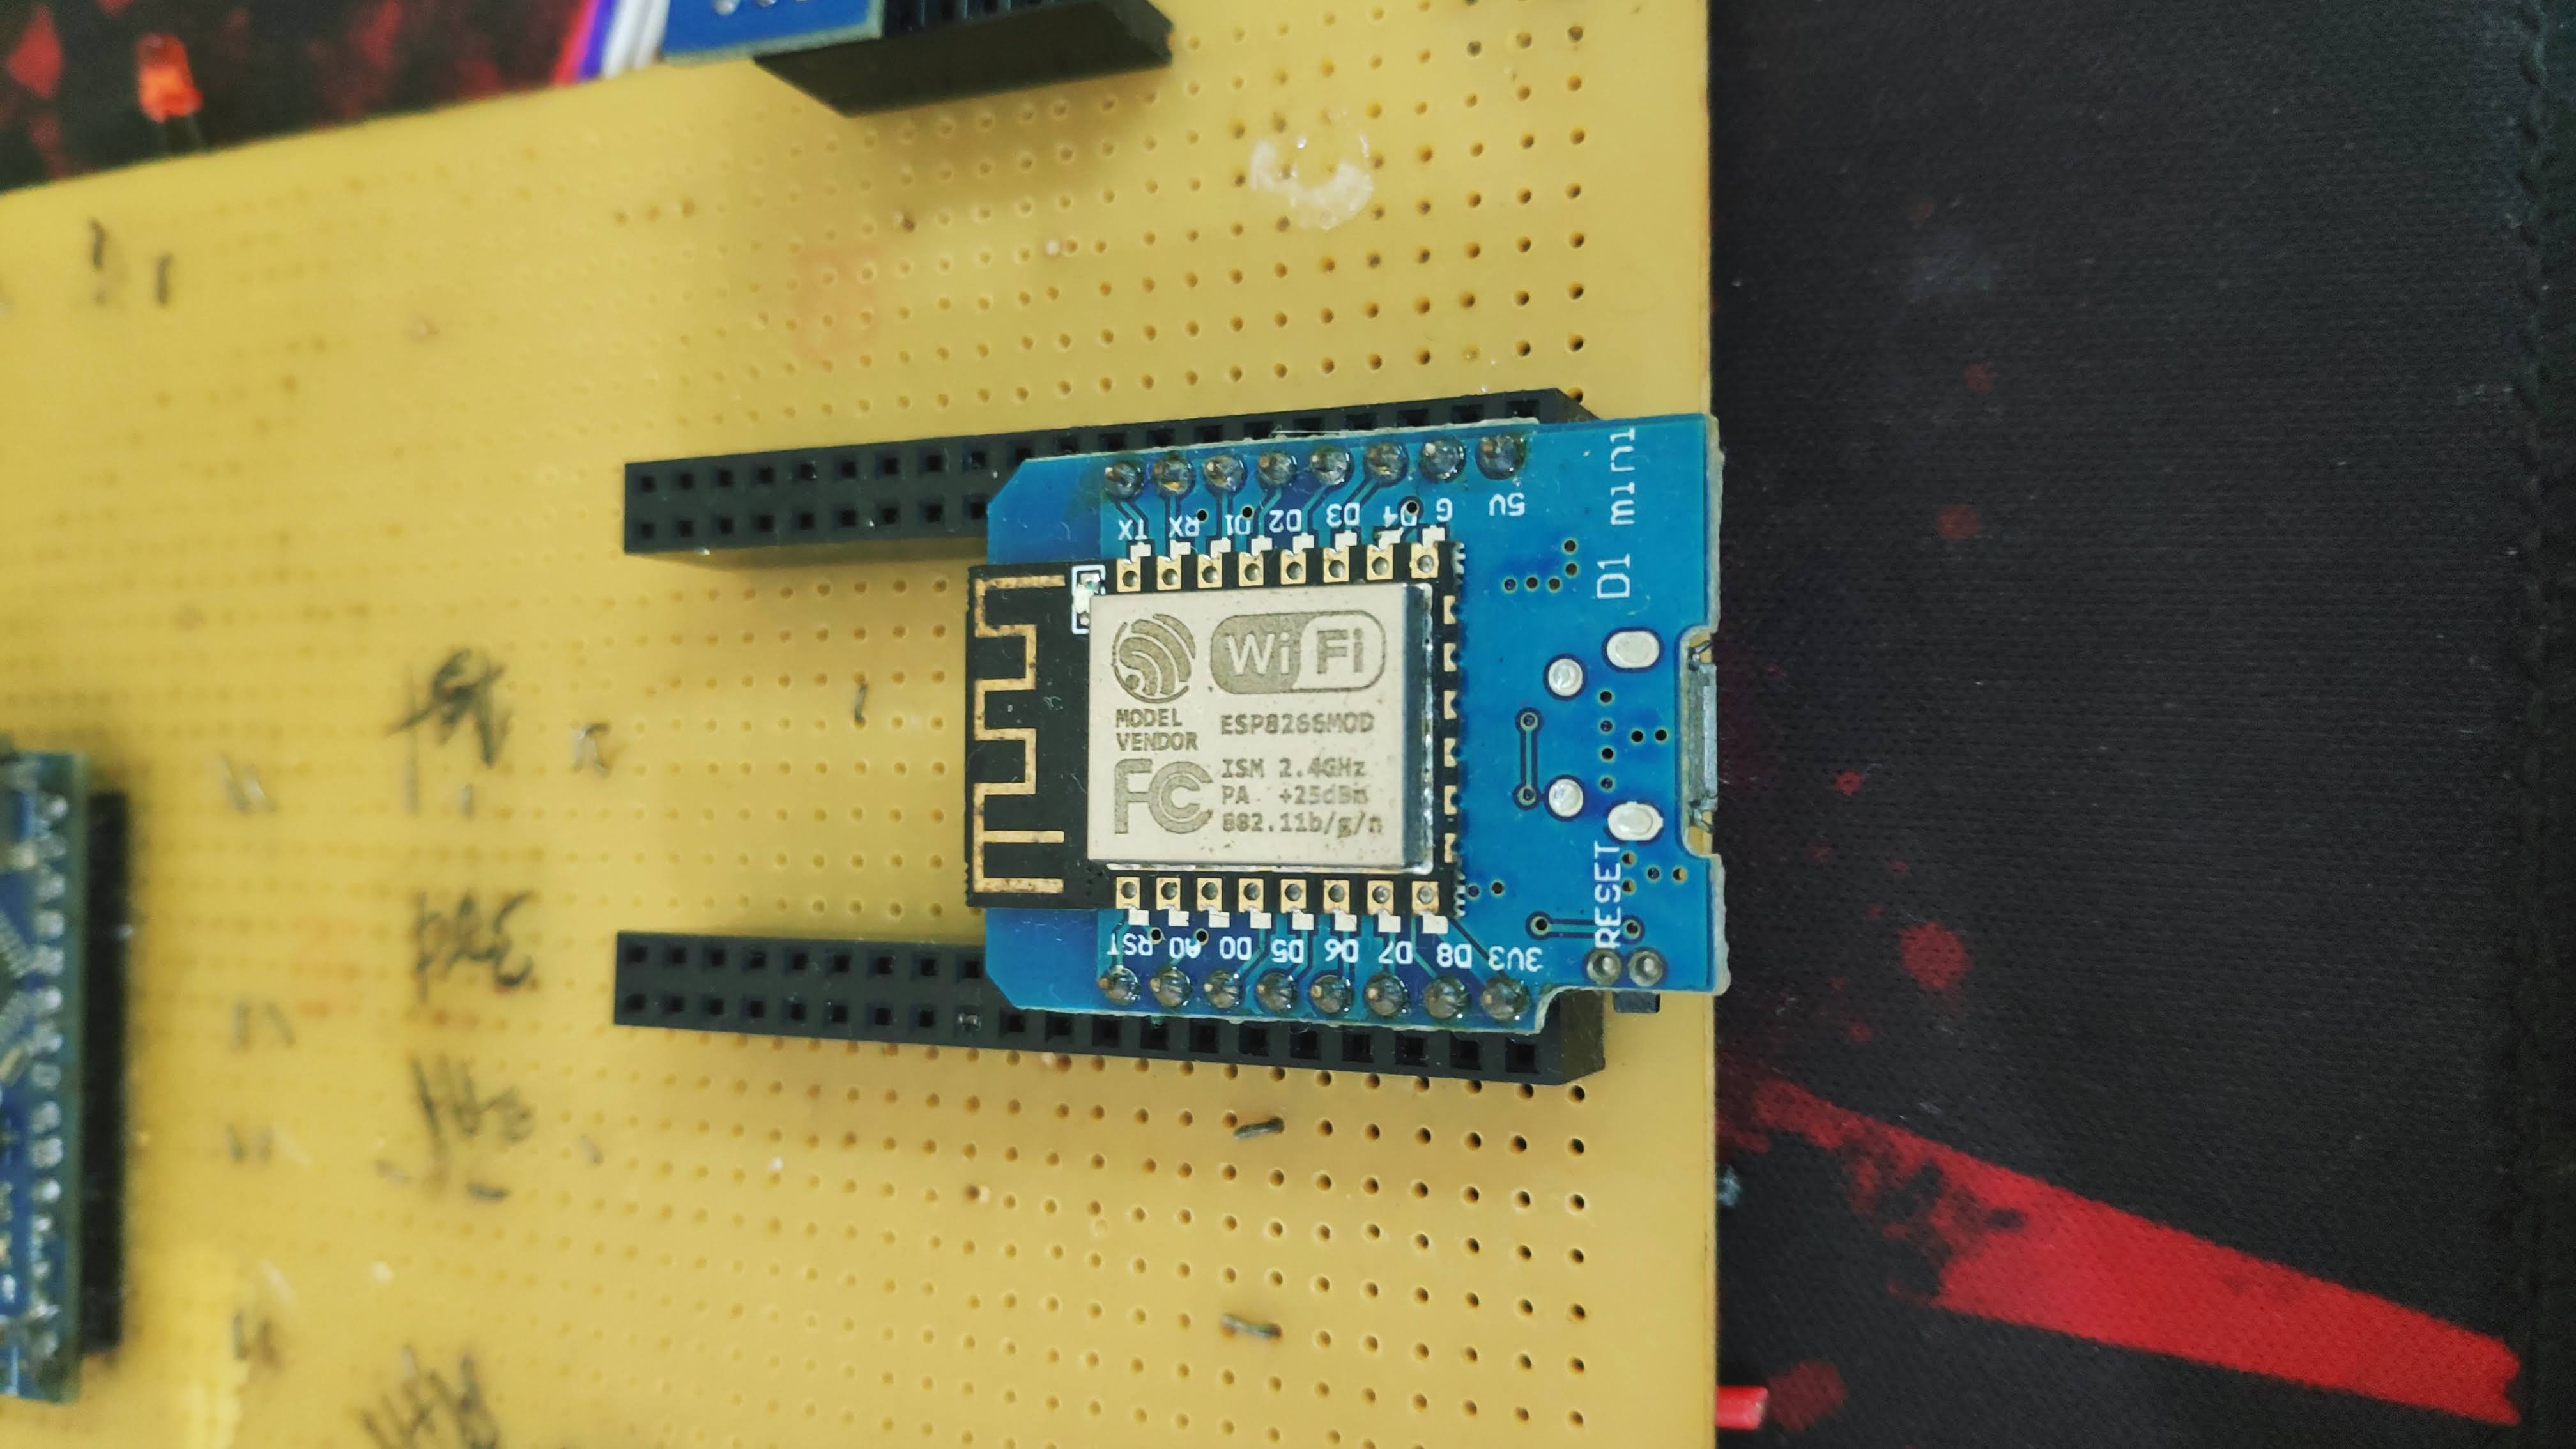
- D1 Mini Pro node MCU V2
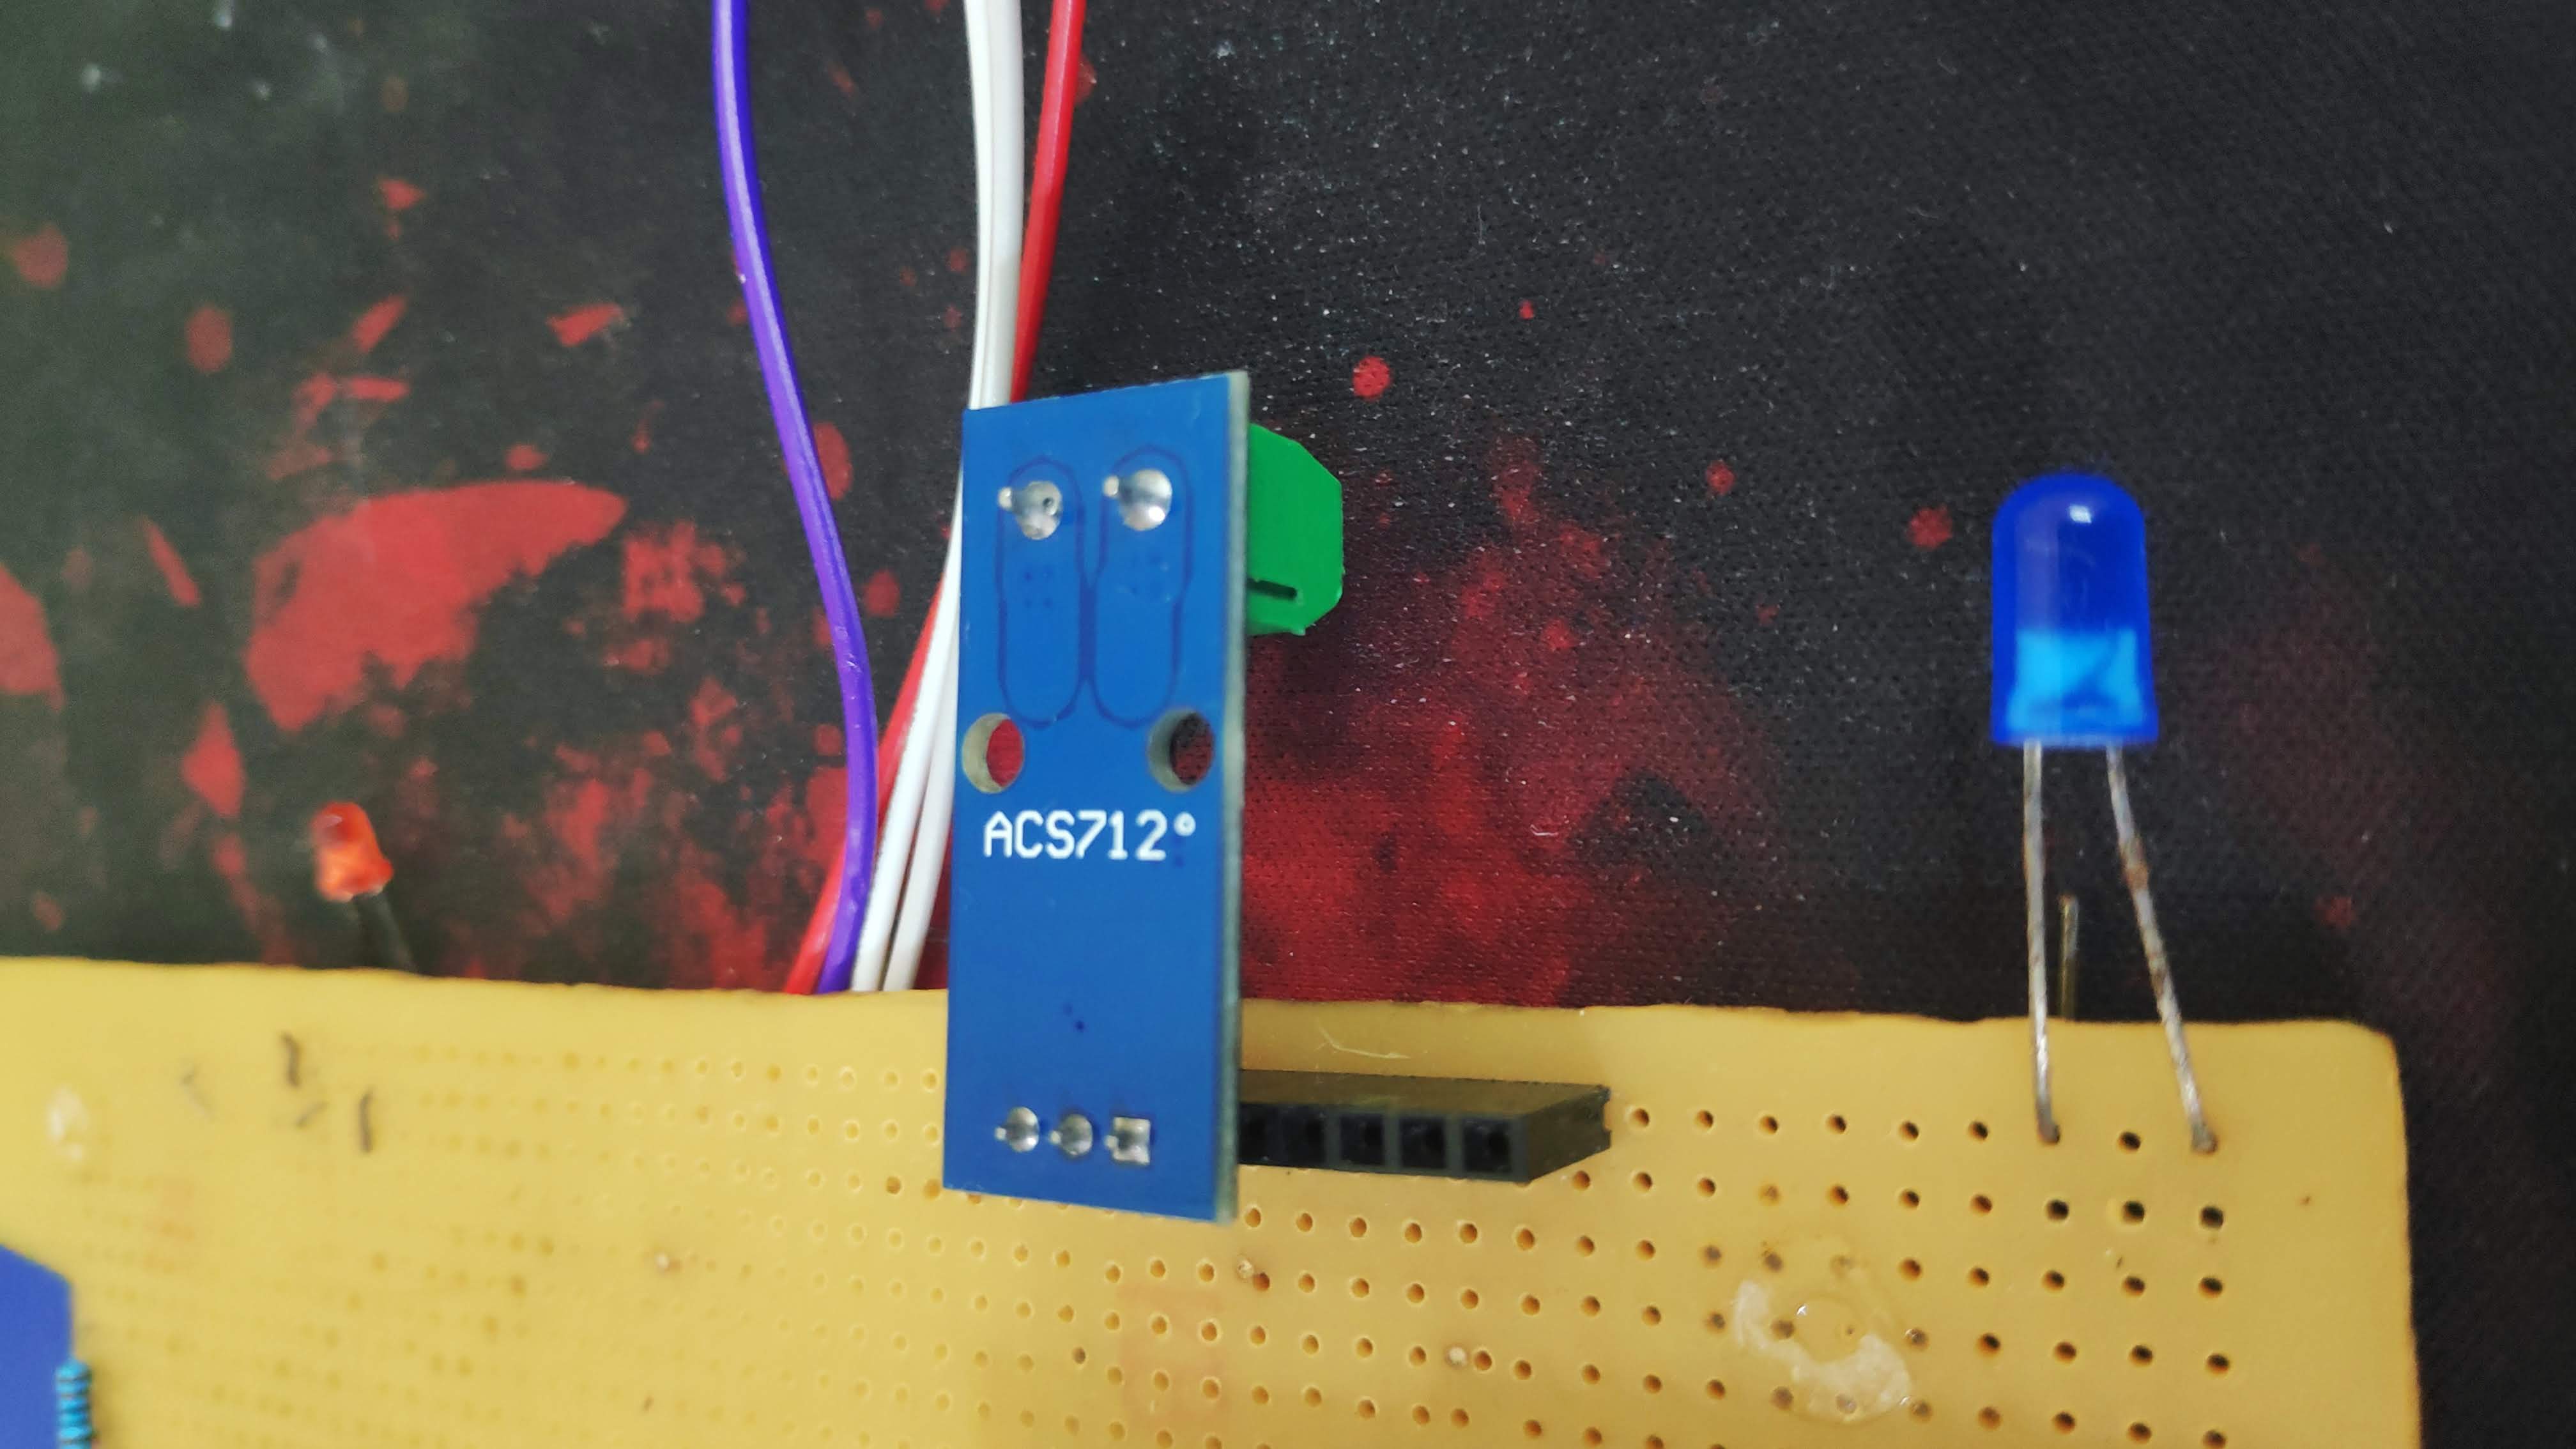
- ACS712 20A Sensor
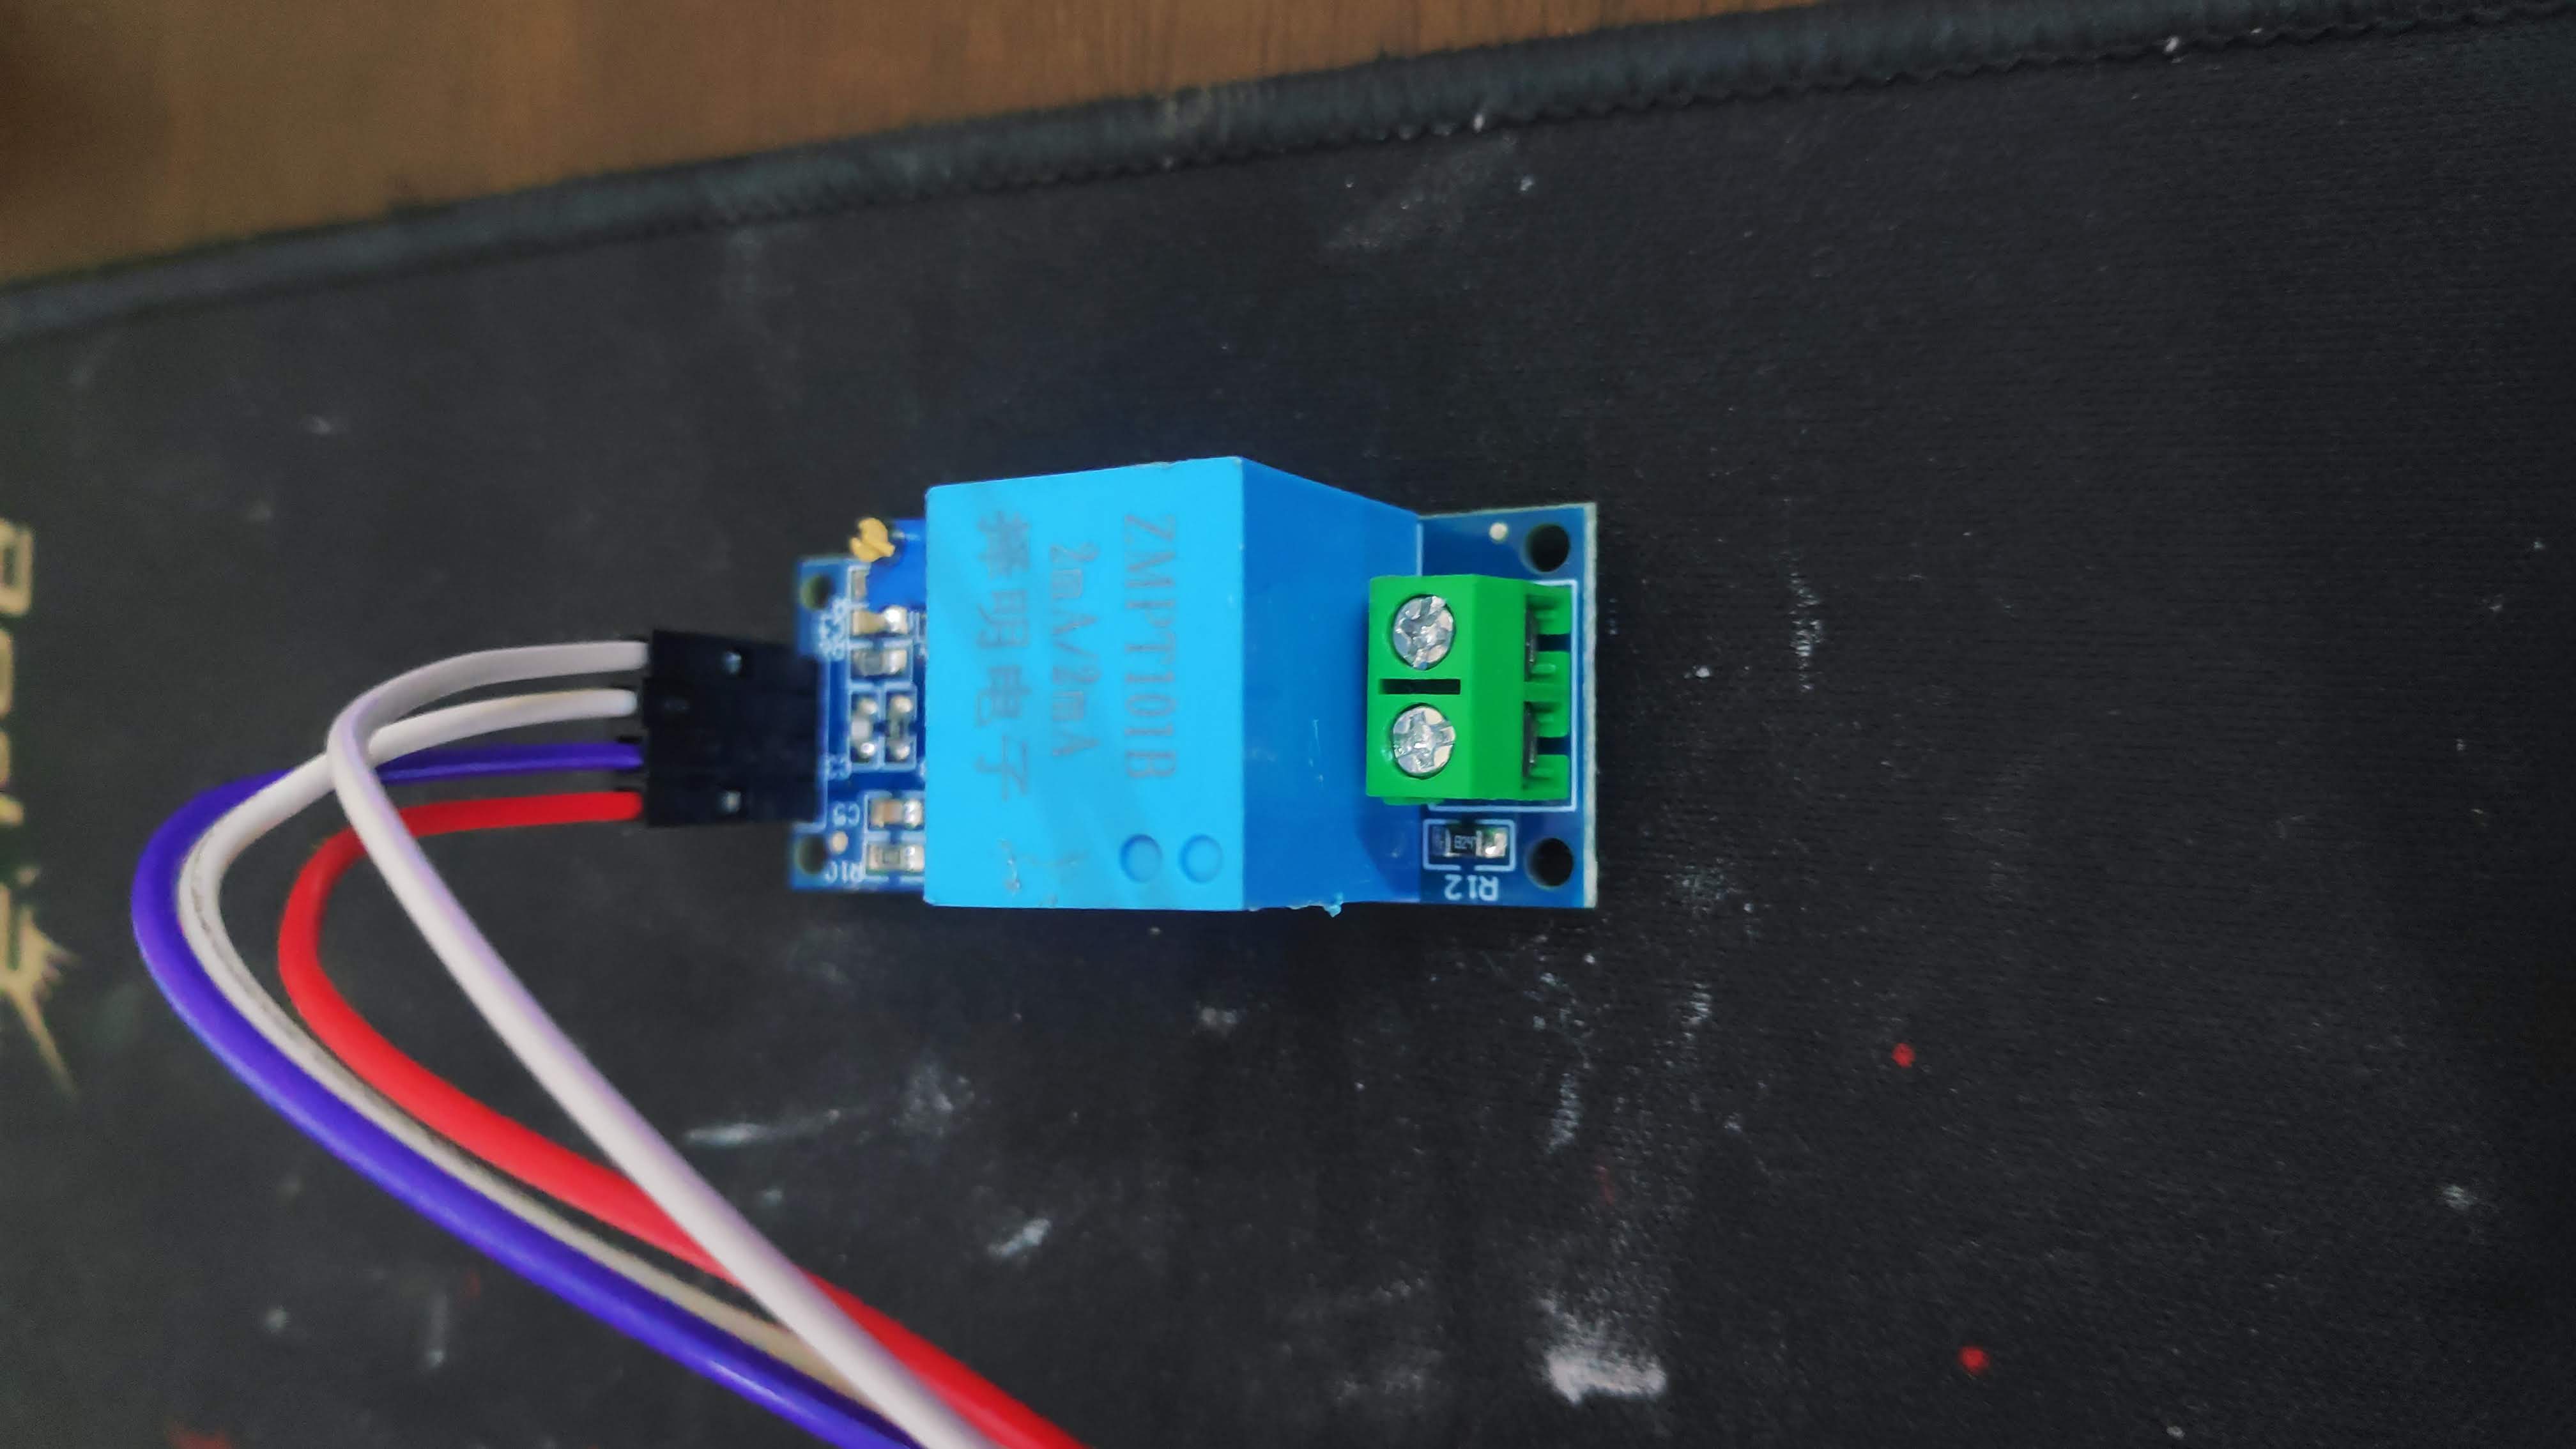
- ZMPT101B-sinlge phase AC voltage sensor
- Connecting Wires
- 20 SWG Wire
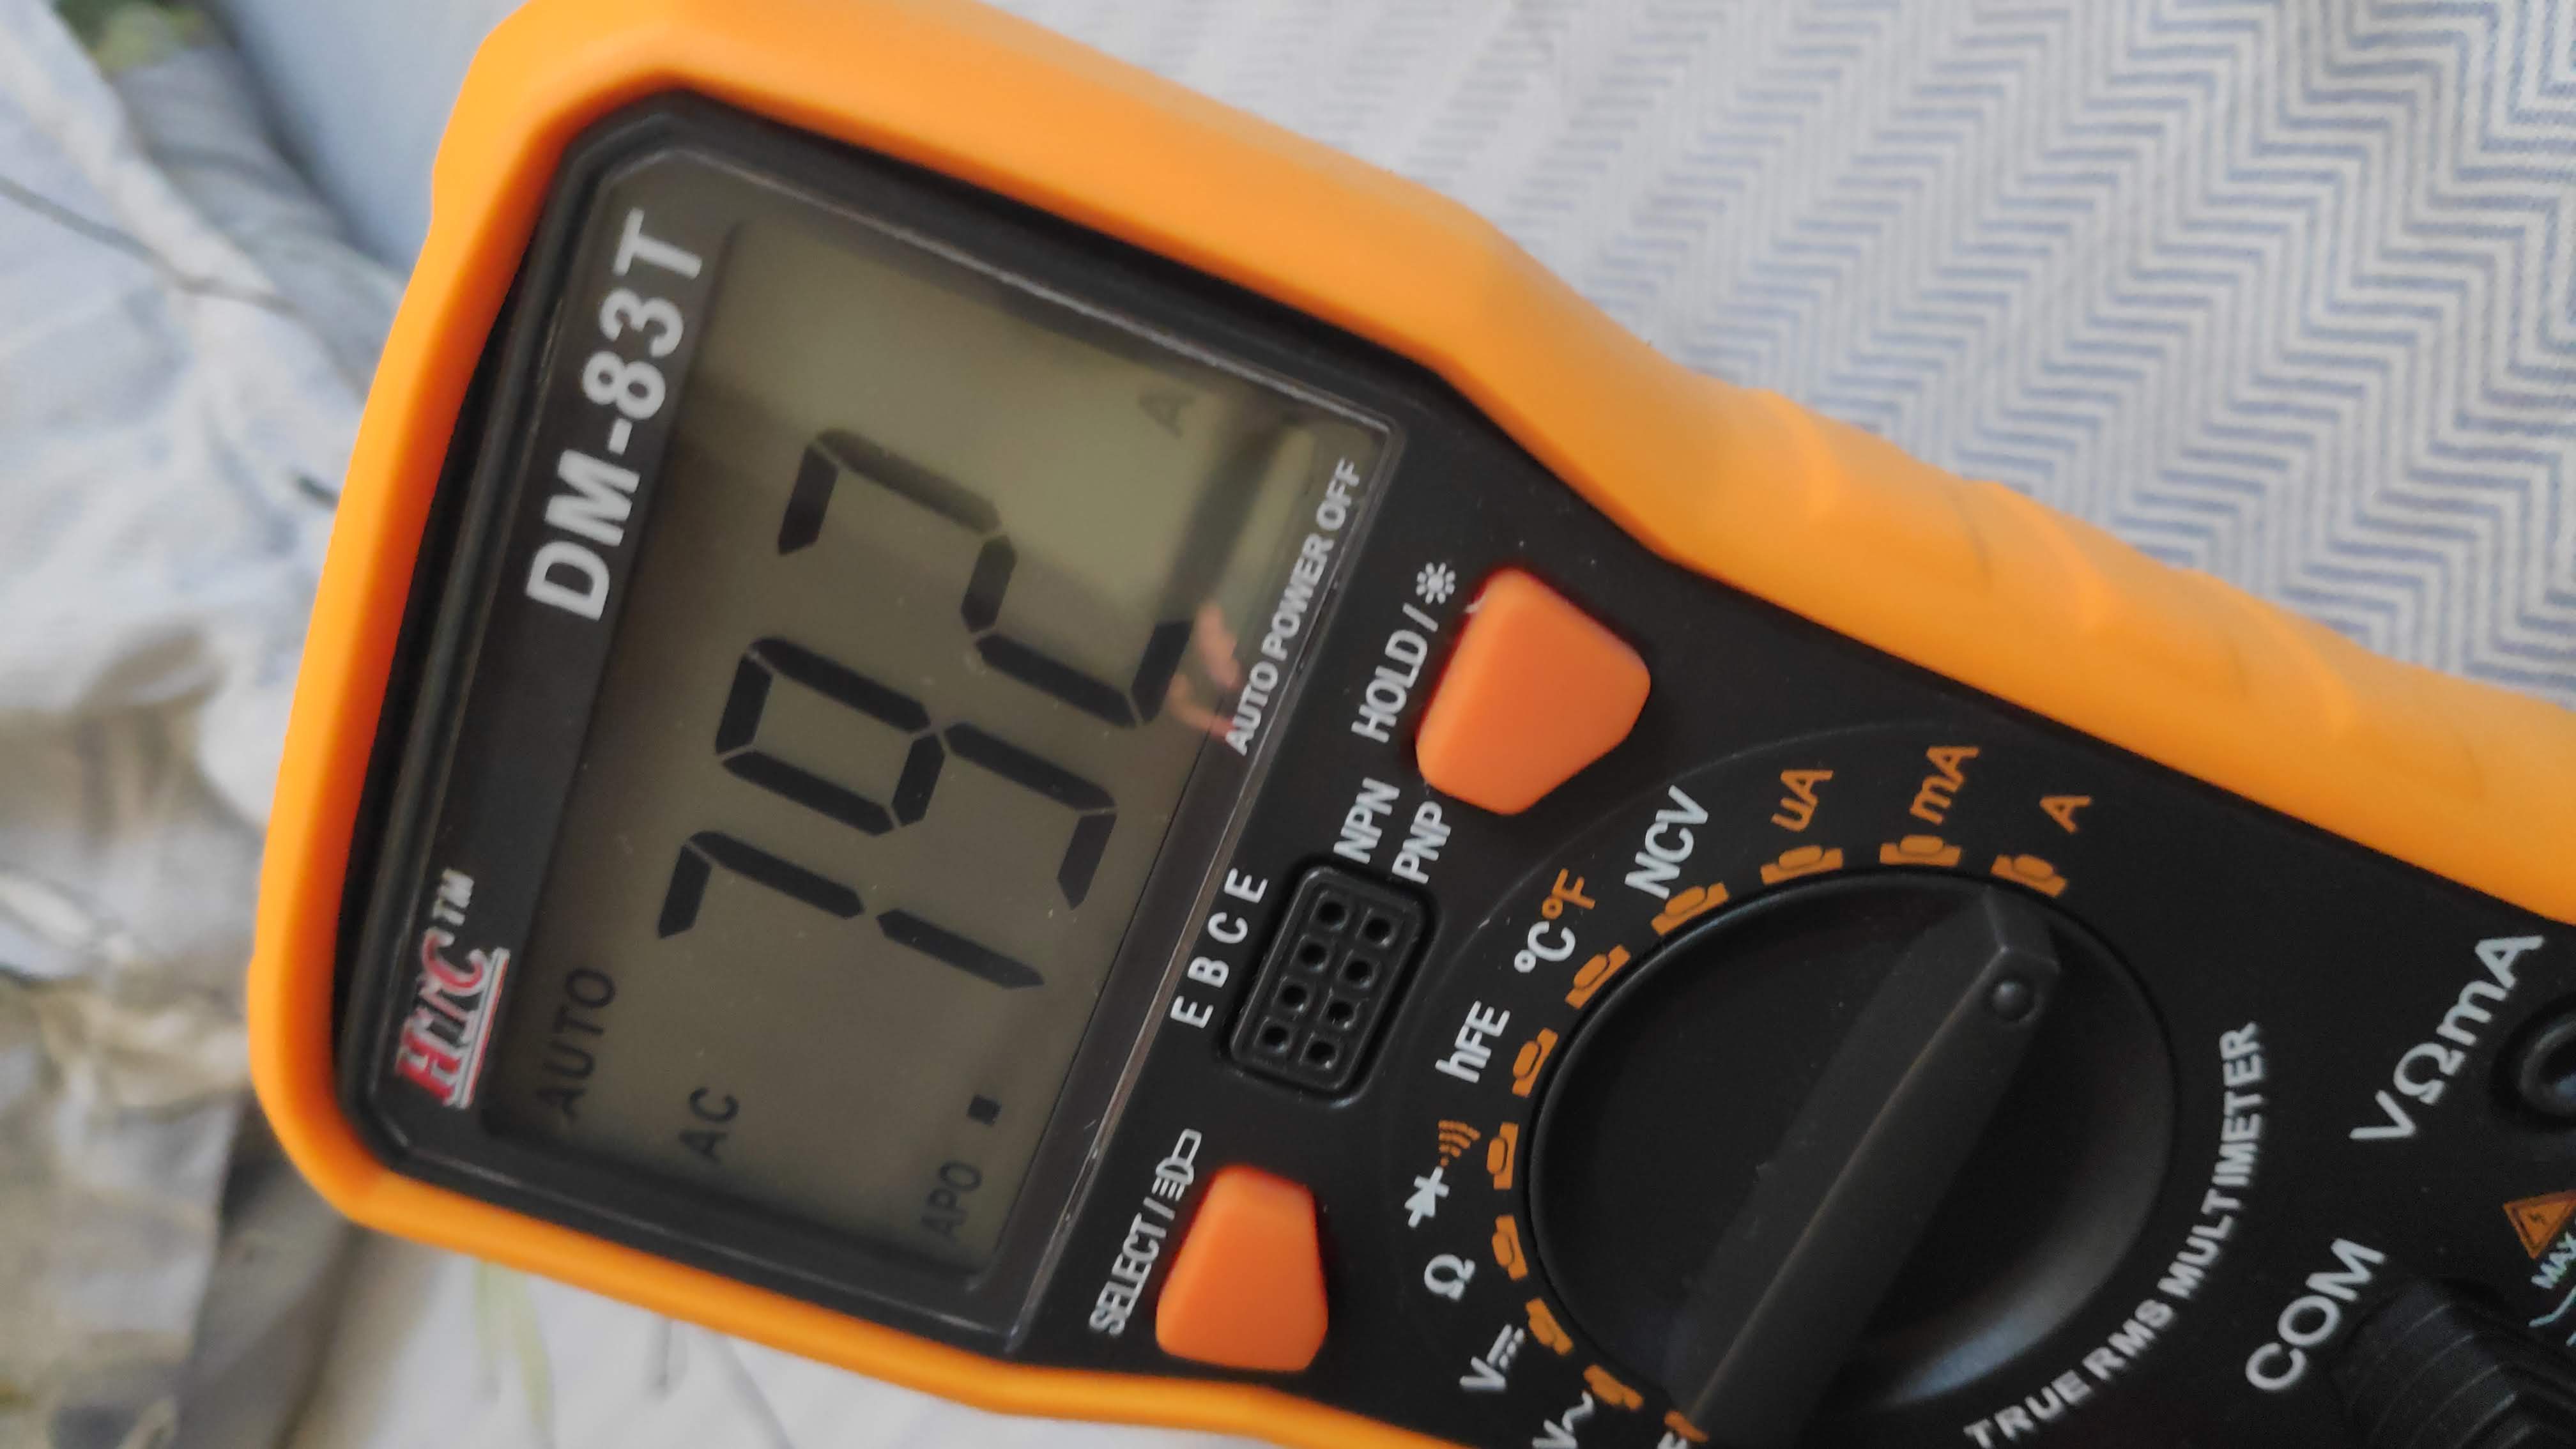
- Multi-meter
- Soldering Iron and Solder Wire
- 1kΩ and 2kΩ resistors
- 60W, 100W and 200W bulbs
- Red and blue led
- 5V Relay
- Arduino IDE
- MIT App Inventor
- Google Firebase
- Microsoft Excel
- HTML
- Server side framework
Works on the principle of hall effect. An output voltage is generated proportional to the current flowing through the sensor. Our system can measure current up to 20A.

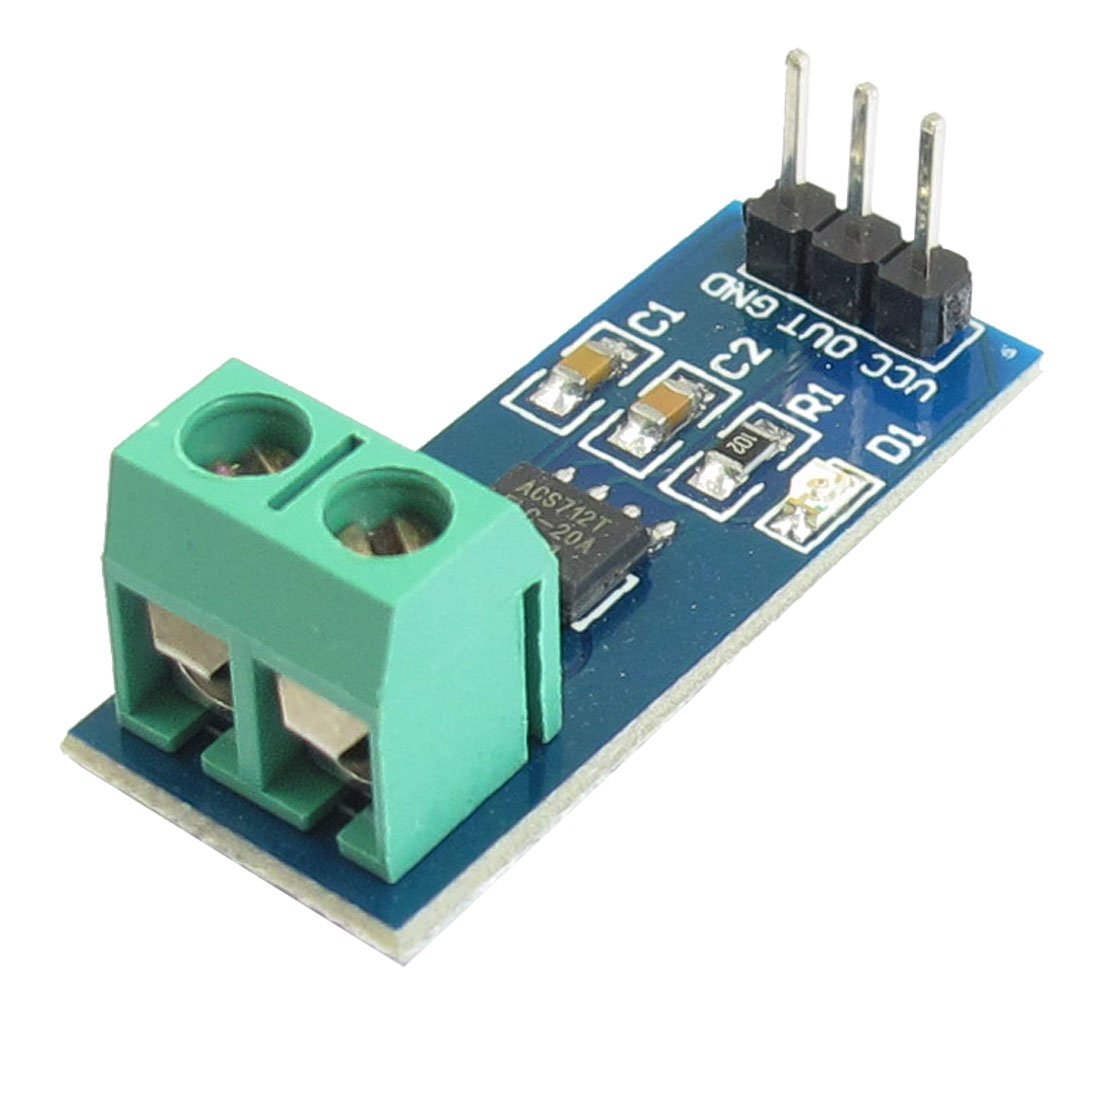
- Low-noise analog signal path
- Sensitivity: 100mV/A
- Measure Current Range: 20A
- Supply Voltage: 4.5V~5.5V DC
ZMPT101B a voltage transform ideal to measure the AC voltage. It has high accuracy, good consistency for voltage and power measurement up to 250V AC. Easy to use and comes with a multi turn trim potentiometer for adjusting the ADC output.

- Output Signal: Analog 0-5V
- Measure within 250V AC
- Onboard micro-precision voltage transformer
- Operating Voltage: DC 5V-30V
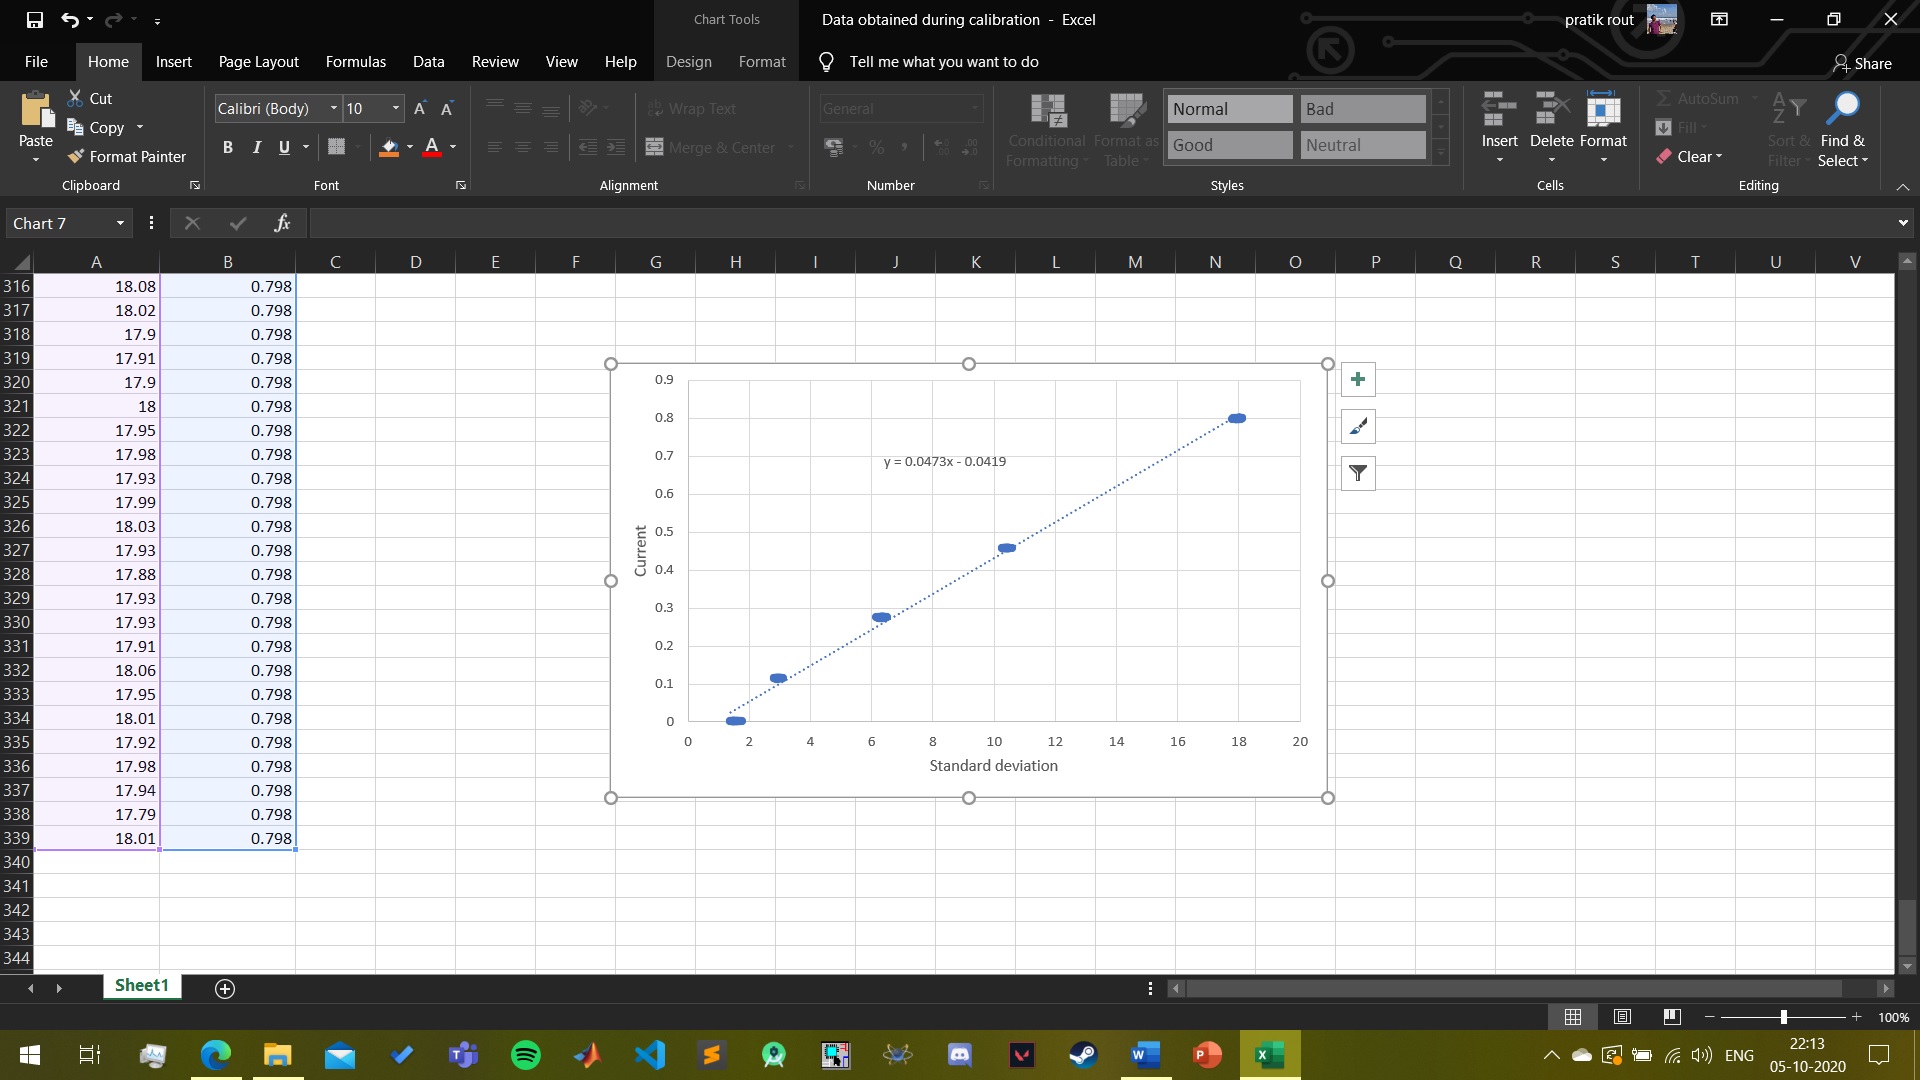
The alternating current generates a sine wave. The values vary over a period of time from negative to positive. Therefore, the RMS value of the current is considered. Now, the ACS712 sensor needs 5V DC to function properly. The sensor keeps 2.5V as the mid-point and measures the proportional voltage around this mid-point. So, the range varies from 0-5V in the output of the sensor with 2.5V as mid-point, which corresponds to the 0-point. When we give alternating current as input to the sensor, the sensor measures the proportional analog voltage around the mid-point of 2.5V. So, we get all varying values of the current, this data is useless to us. Suppose we applied 8A as input then changed it to 10A, the change in value won’t reflect in the analog output of the sensor. Similar problem for ZMPT101B sensor

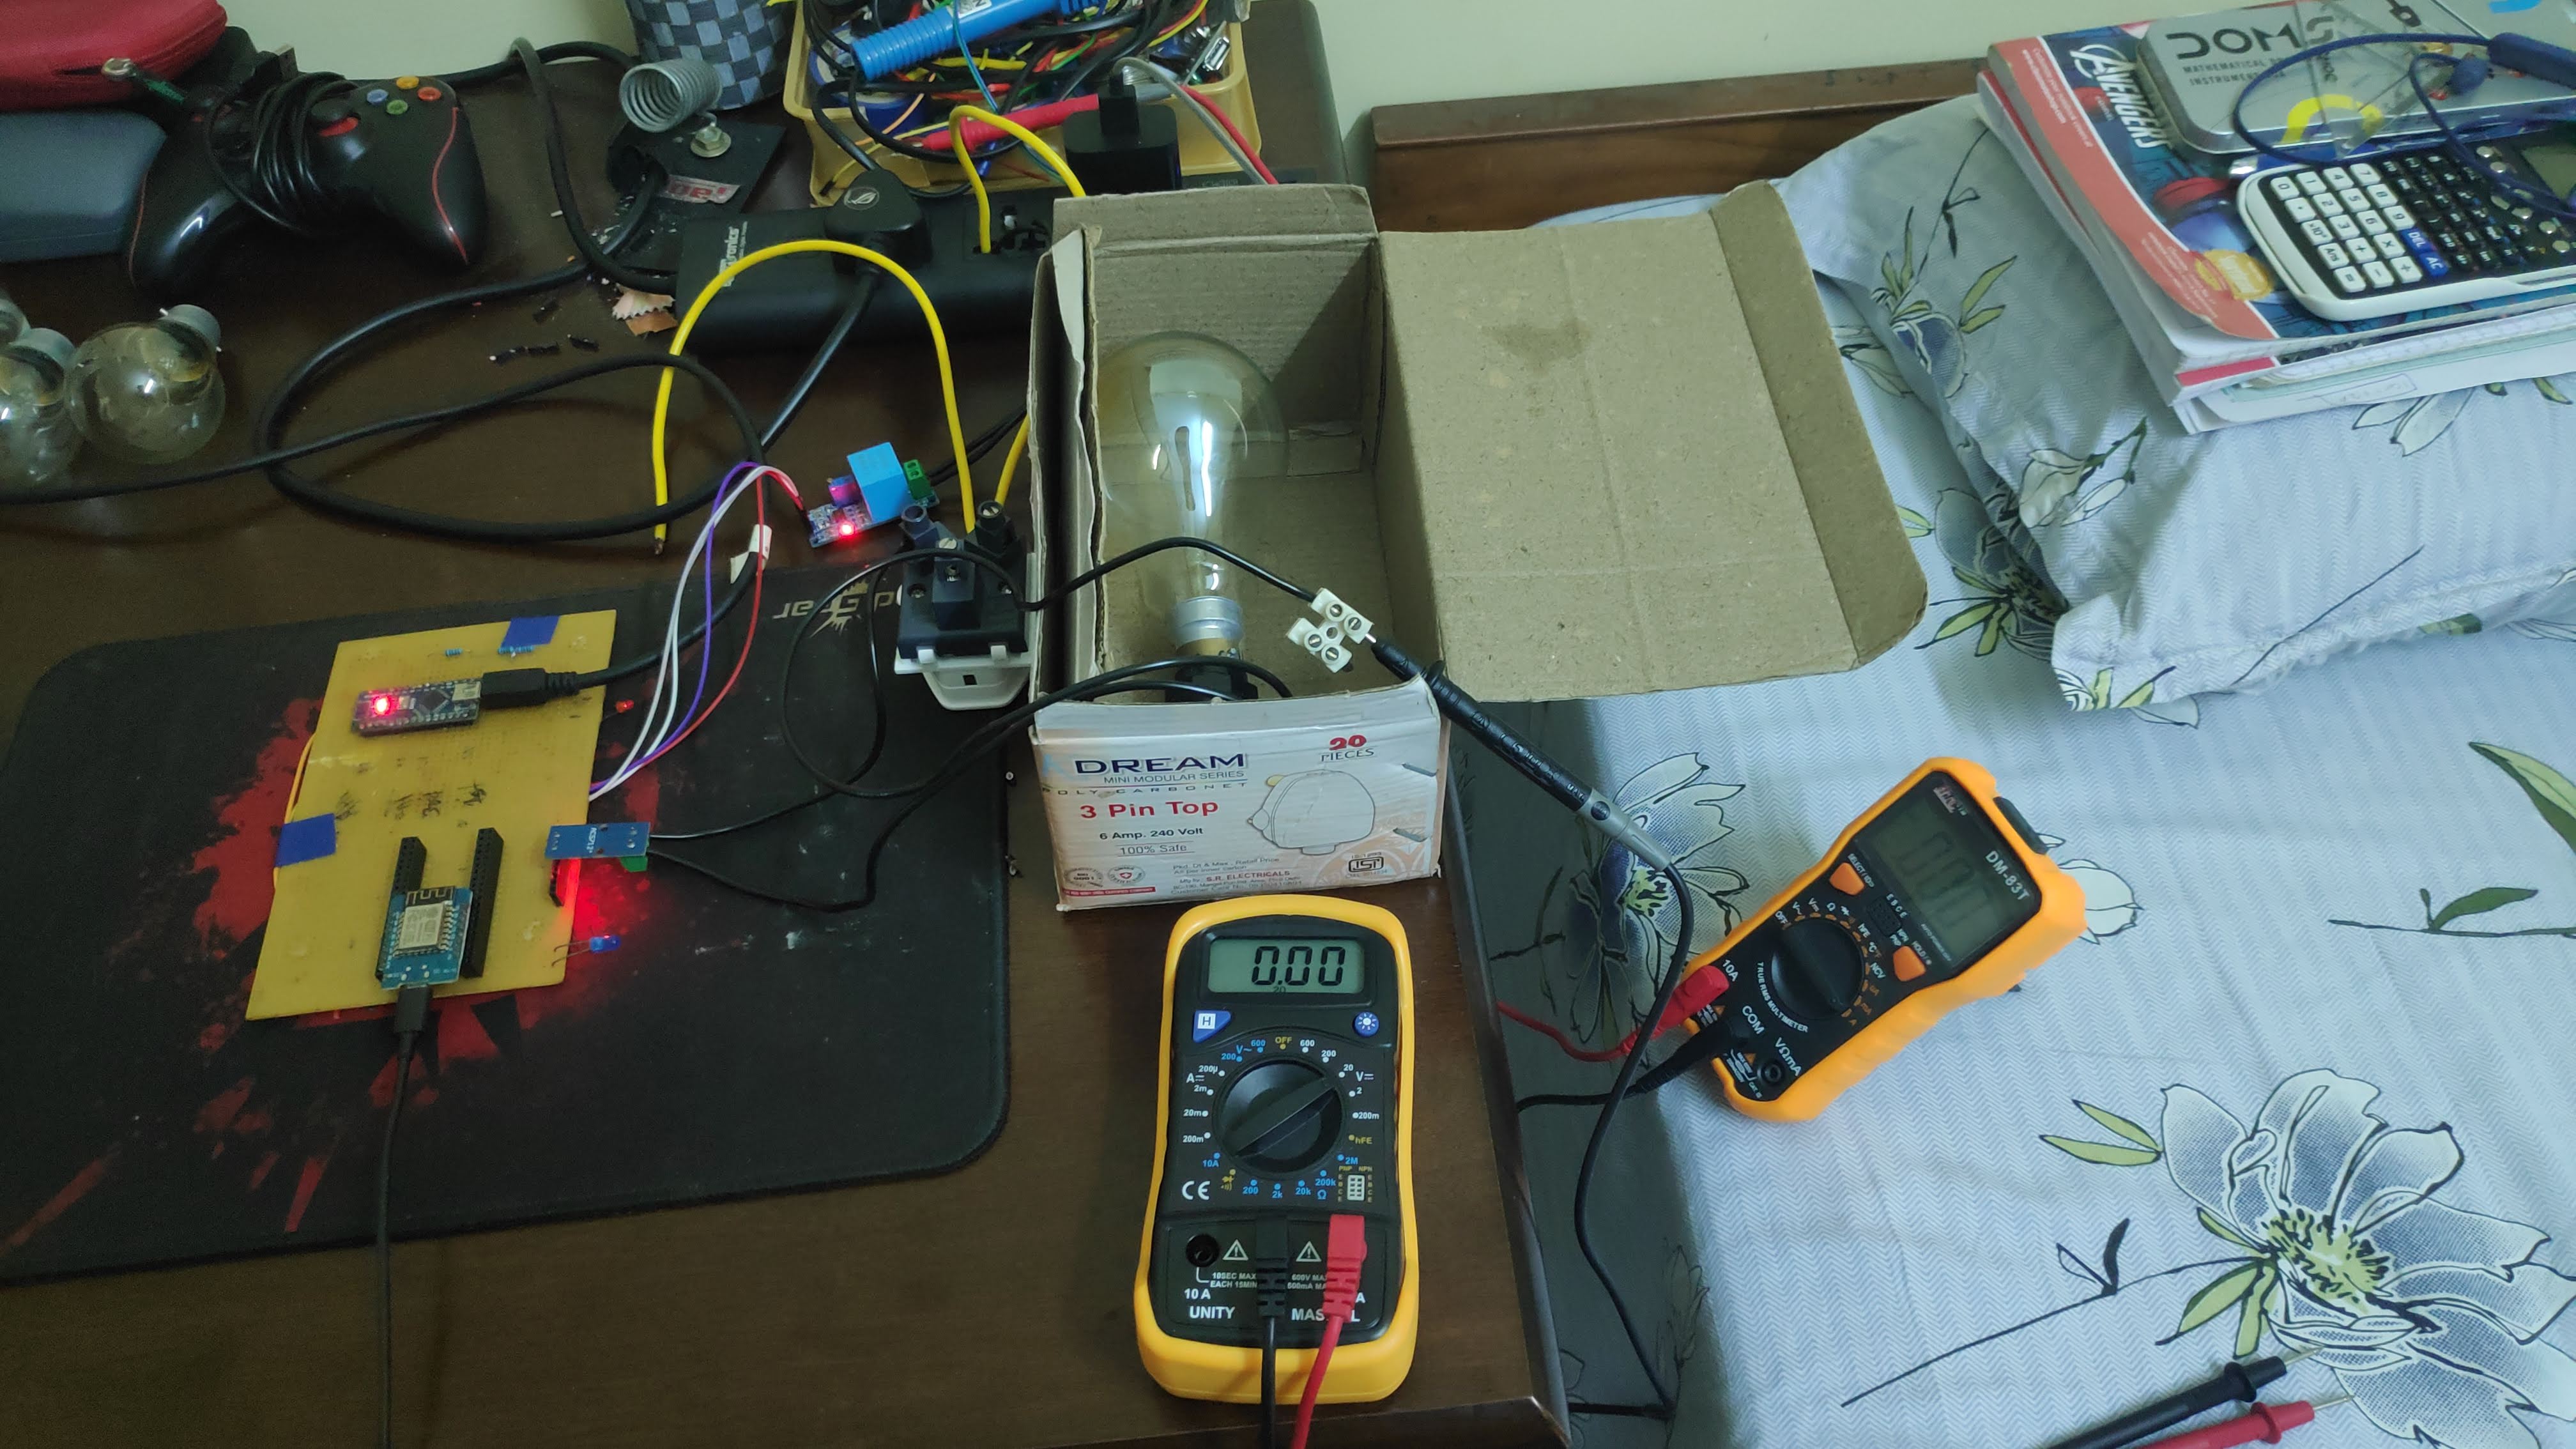
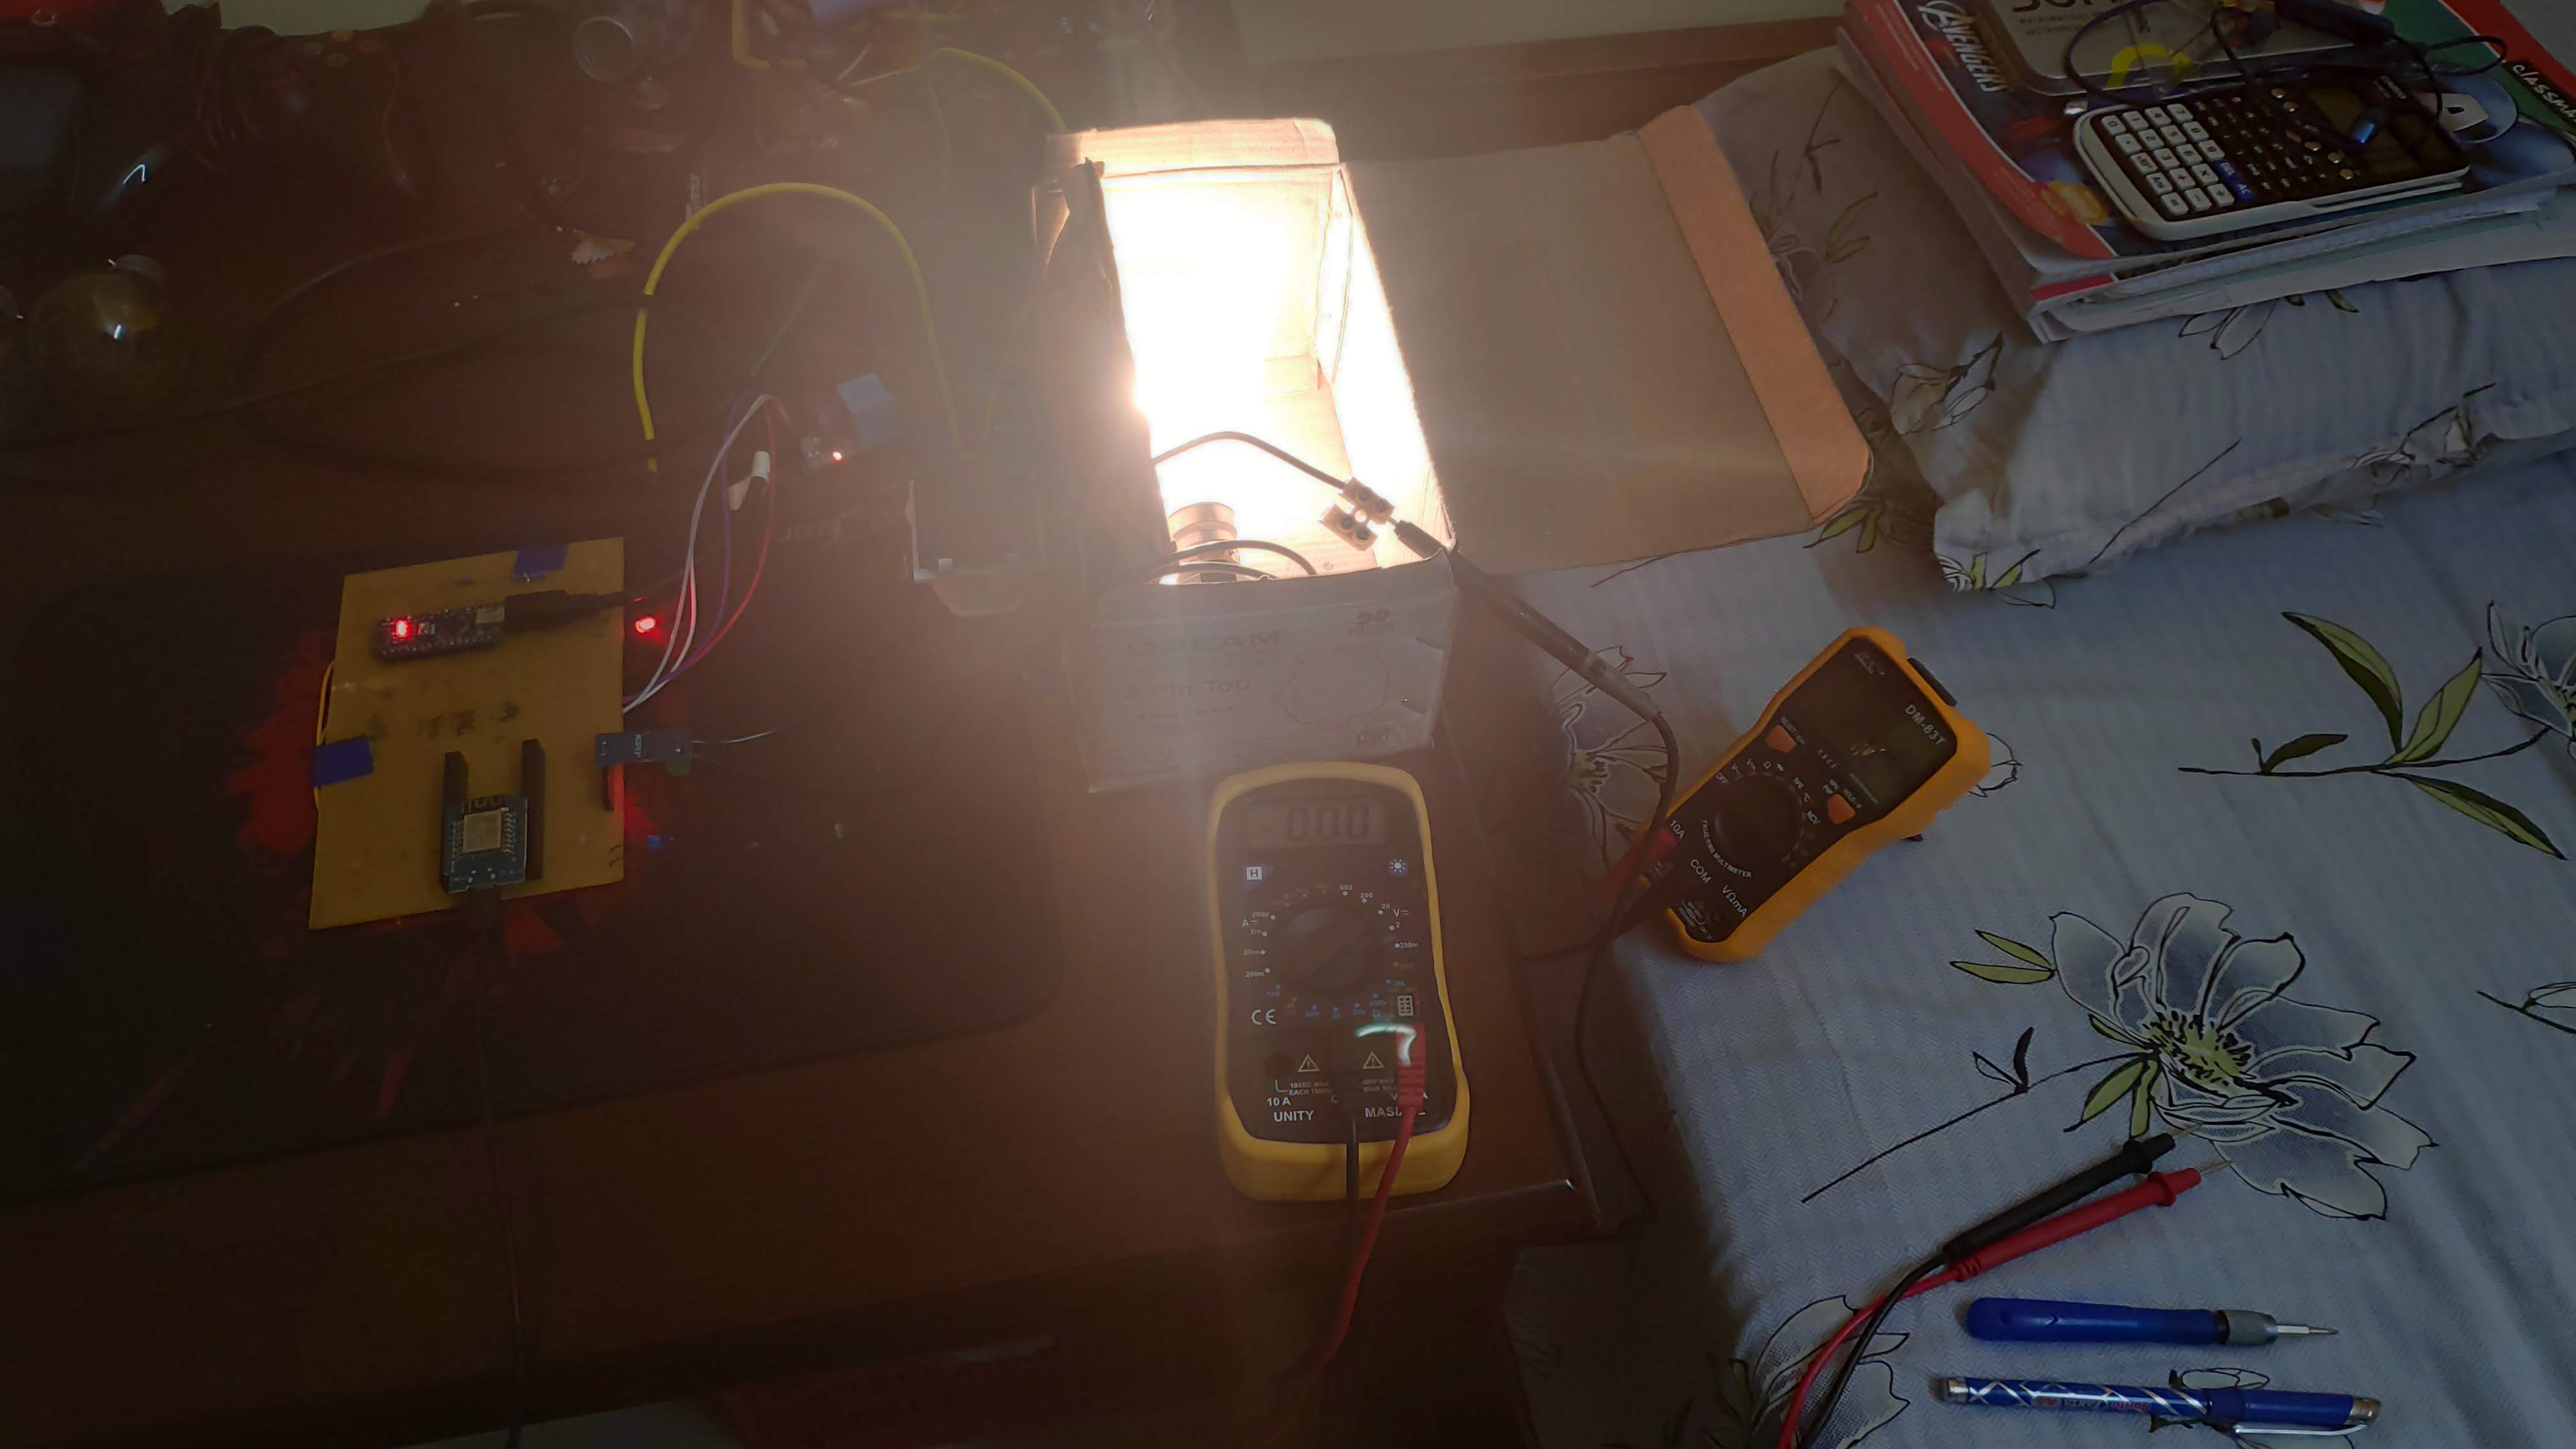
To overcome this problem, we tried to measure the standard deviation of input current around the 2.5V midpoint. We took 20 readings per second, then measured their standard deviations and then averaged them. In this way, we measured the fluctuations in the analog output of the sensor. Then we took 3 blubs of 60W, 100W, and 200W and then connected them to the sensor one by one, to measure the output standard deviations which the sensor was sending to the Arduino. Each bulb was switched on for about a minute and the respective values were recorded. Then we copied the values to an excel sheet. A digital multimeter was connected in series with the bulbs to know the actual RMS currents. Similarly, the current values were noted from the digital multimeter and copied to the excel sheet. In the excel sheet, we plotted a graph between the current and the standard deviations and found the line of best fit. The graph gave us an approximate equation relating to the two data variable.
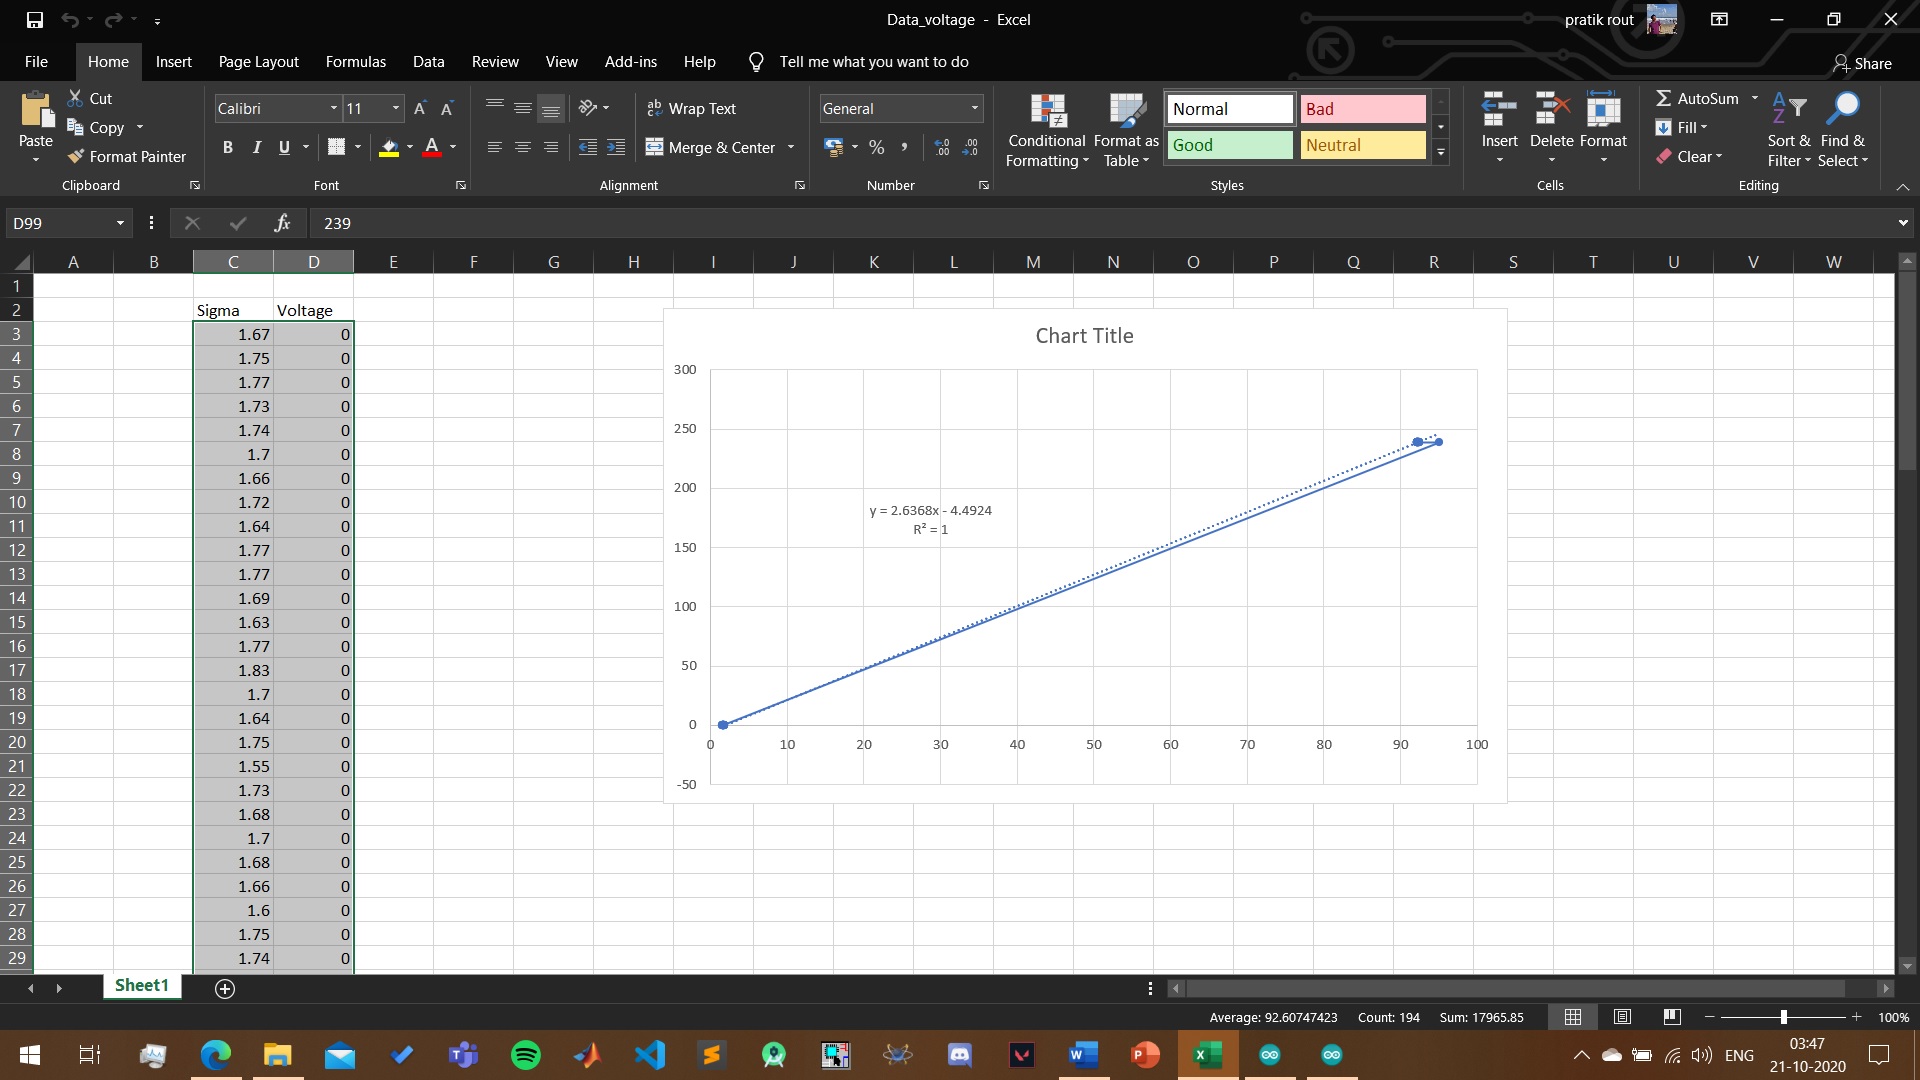
Similarly for ZMPT101B sensor we plot the data and find the line and equation.
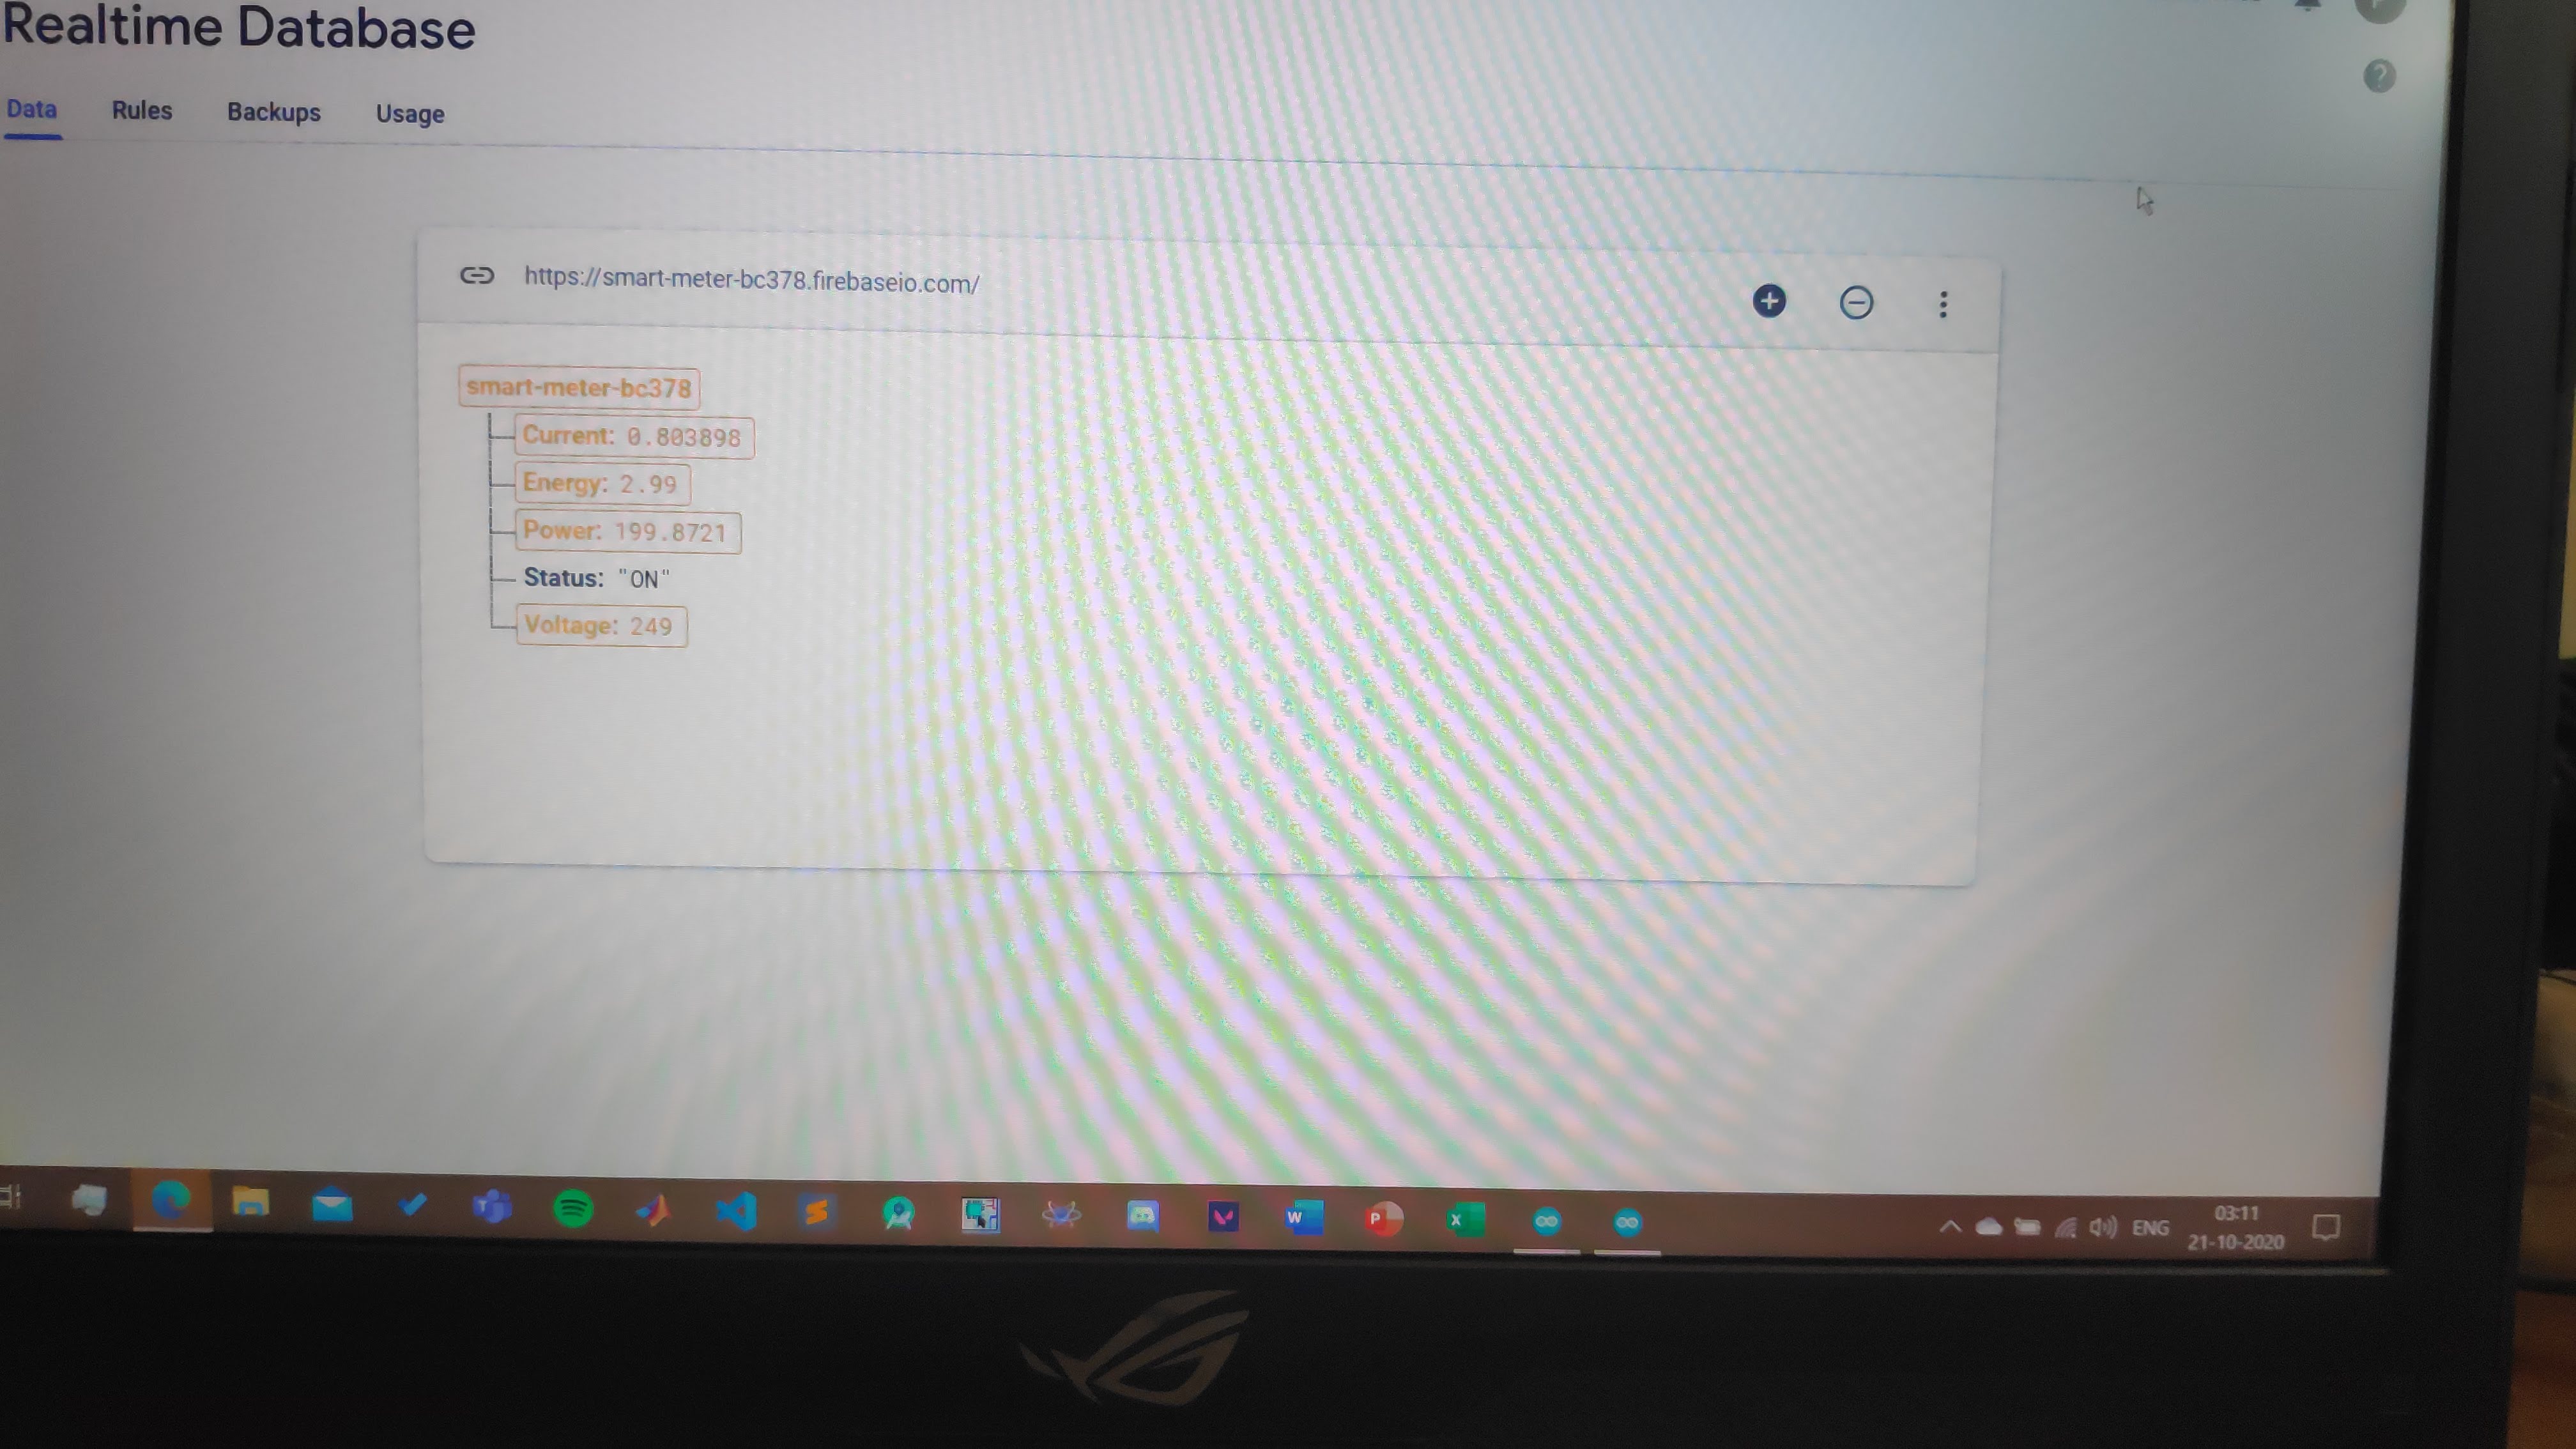
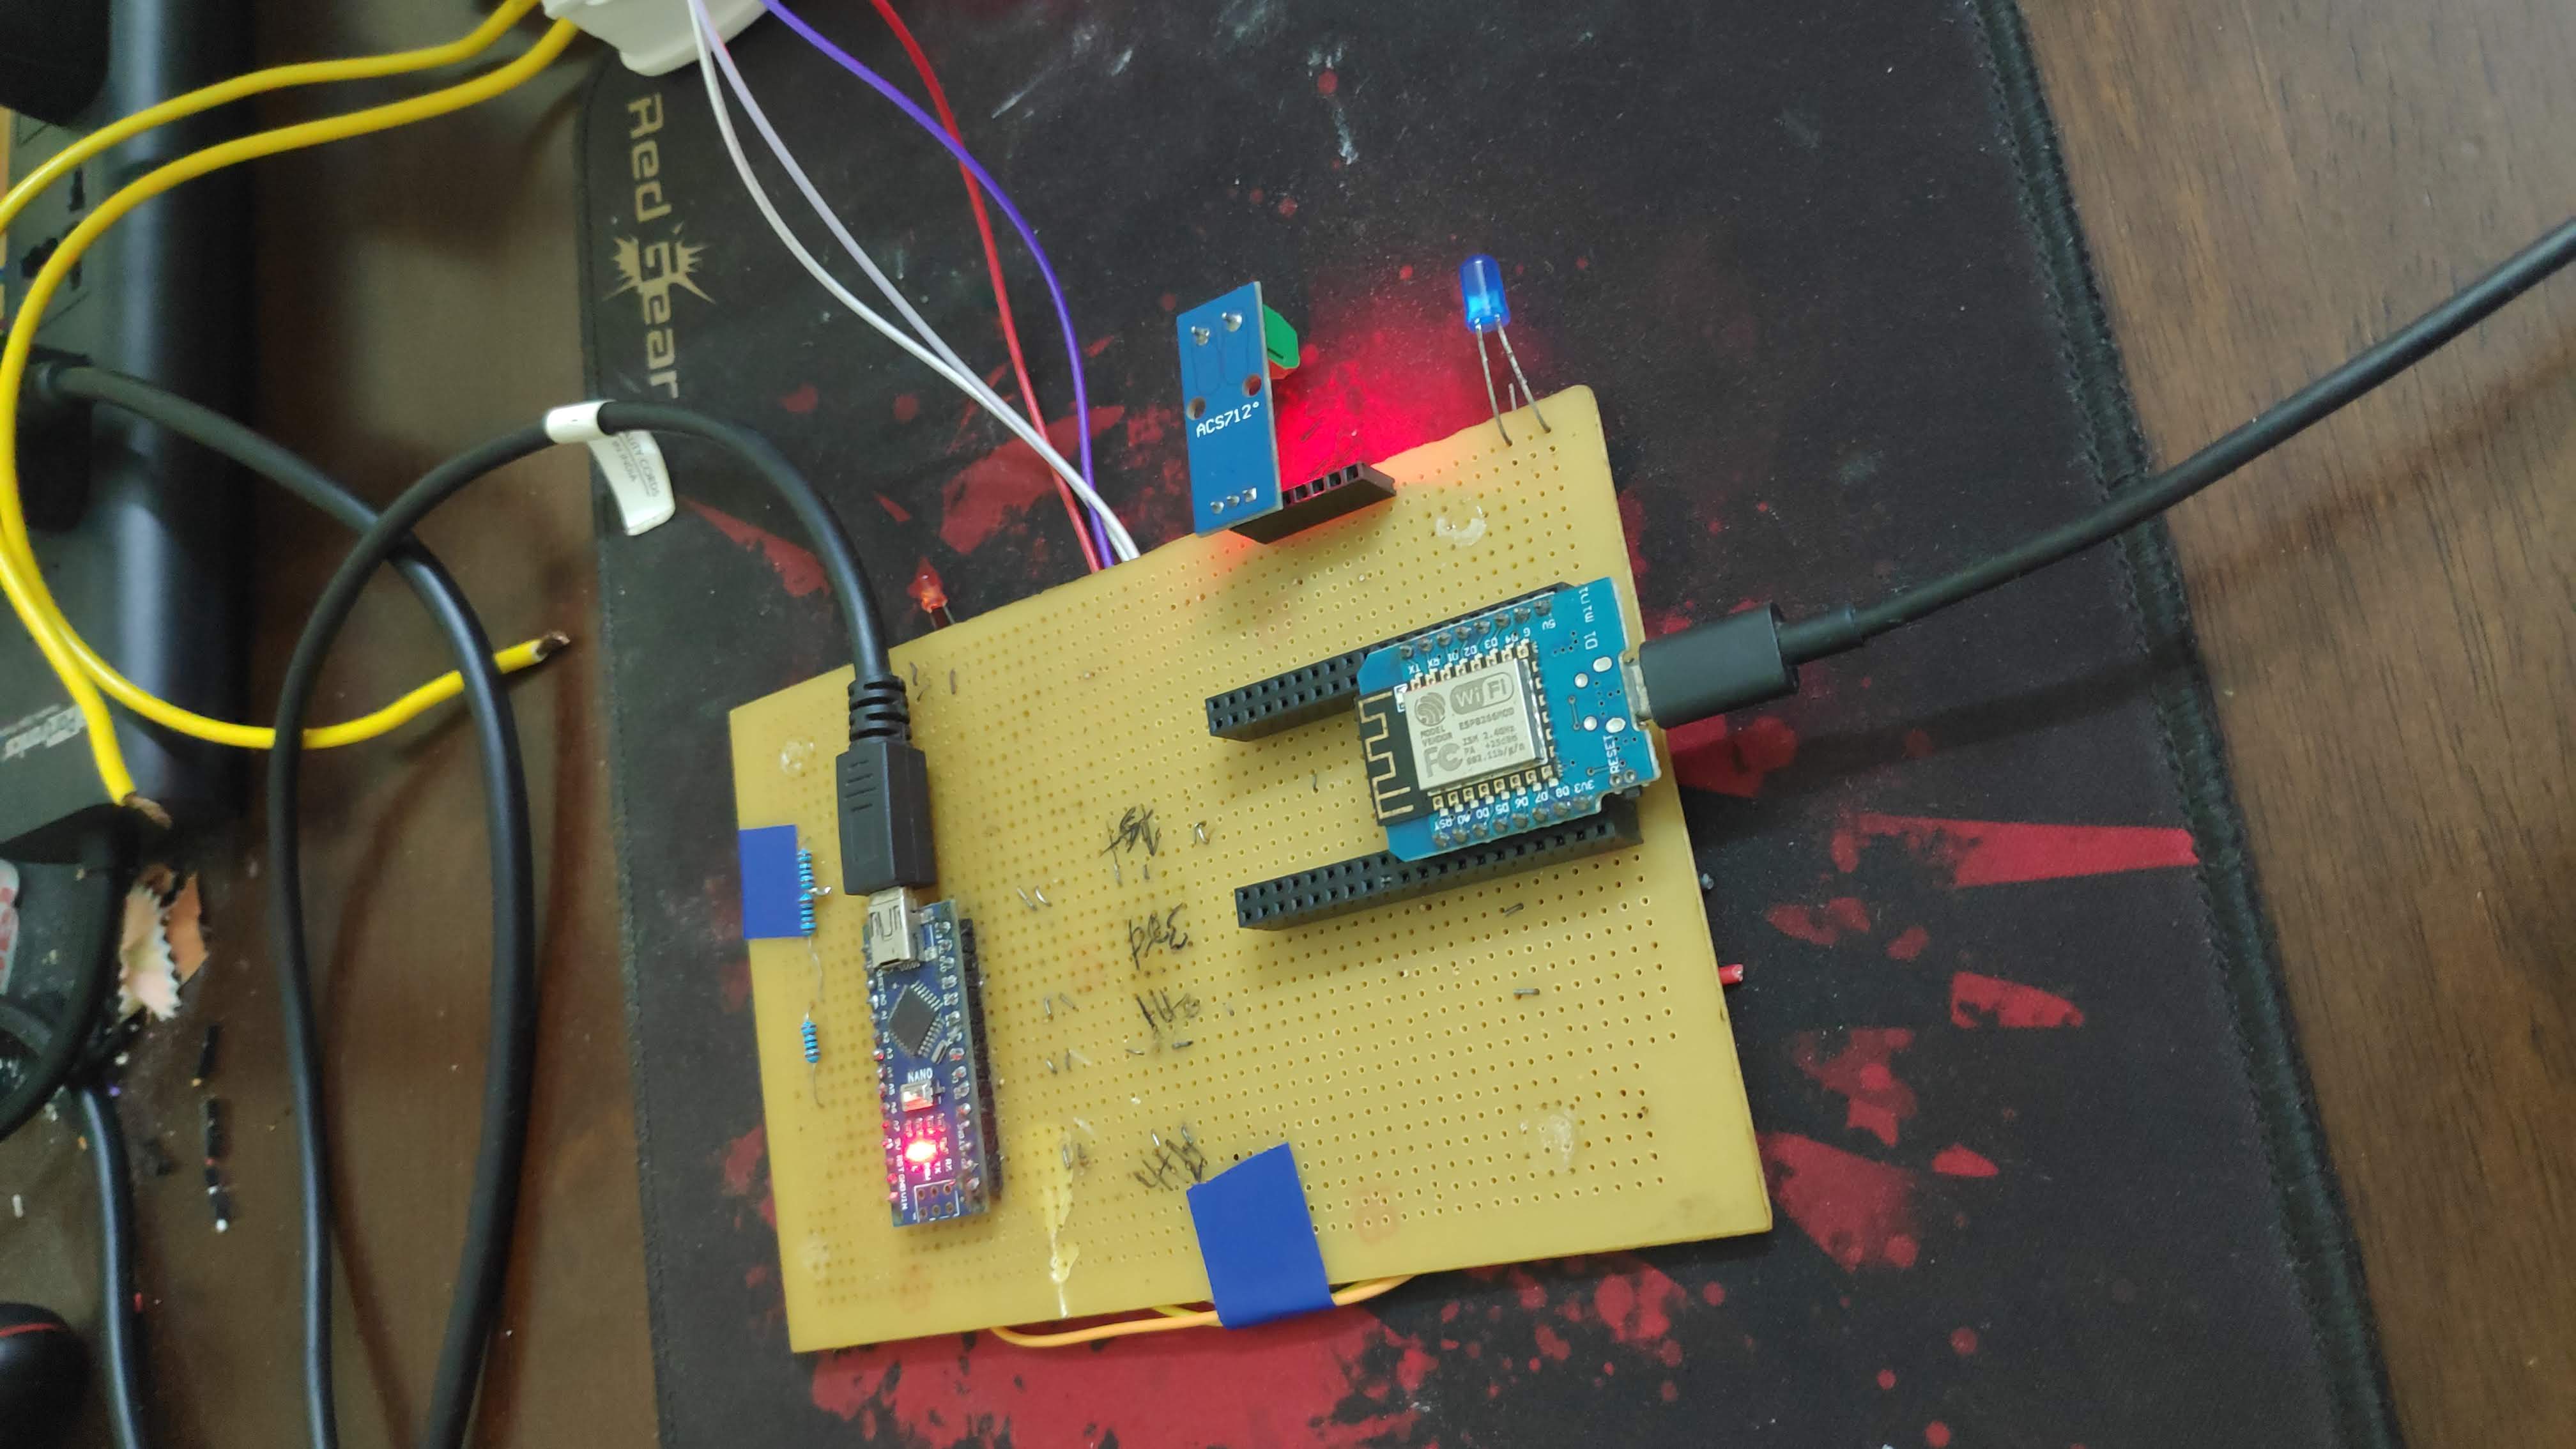
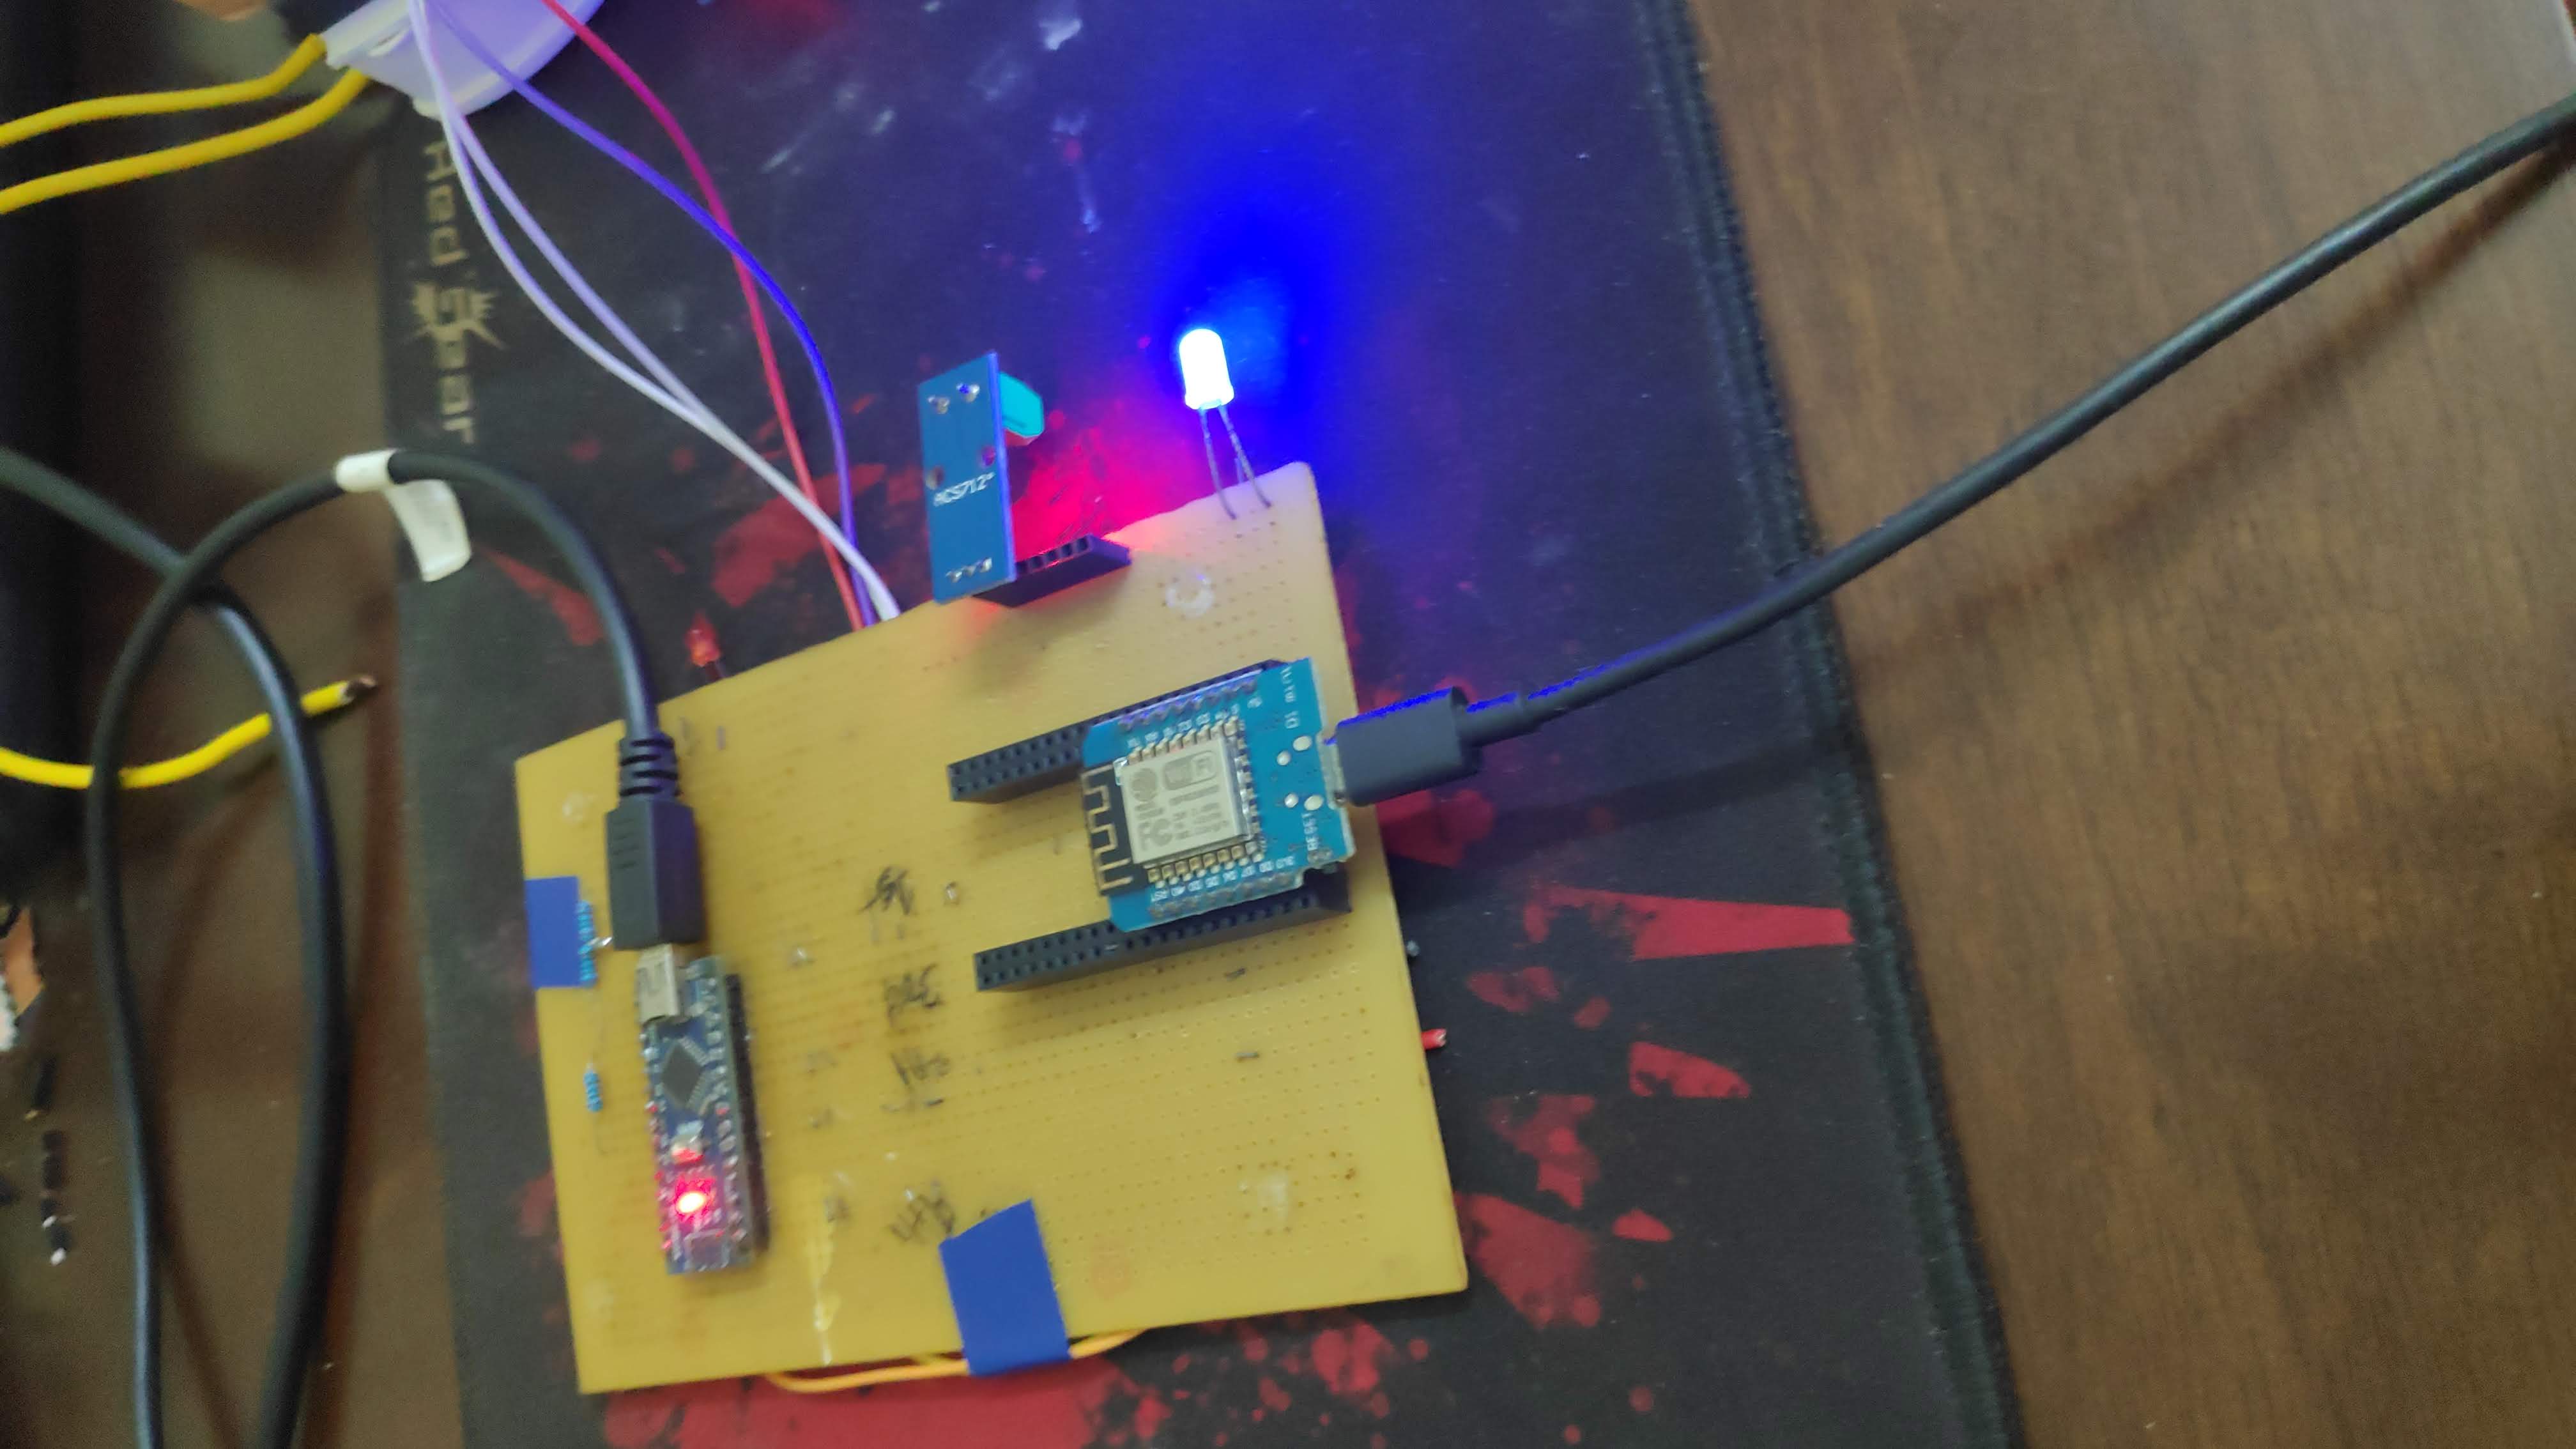
In our project, we are sending the data through the internet to our database, so that our website and the mobile app can access that data. Arduino as such does not have a WIFI chip inbuilt. So, we had to use a separate WIFI chip (ESP8266 node MCU) in serial communication with the Arduino board, to send the data to the database. Here, one could ask why didn’t we just connect the sensor to the node MCU. The problem was, node MCU provides 3.3V max as output voltage for peripherals but the sensor needed at least 5V DC as input for proper working. Therefore, we used two boards here, Arduino for reading and computing the sensor values, and node MCU for sending data to the database.
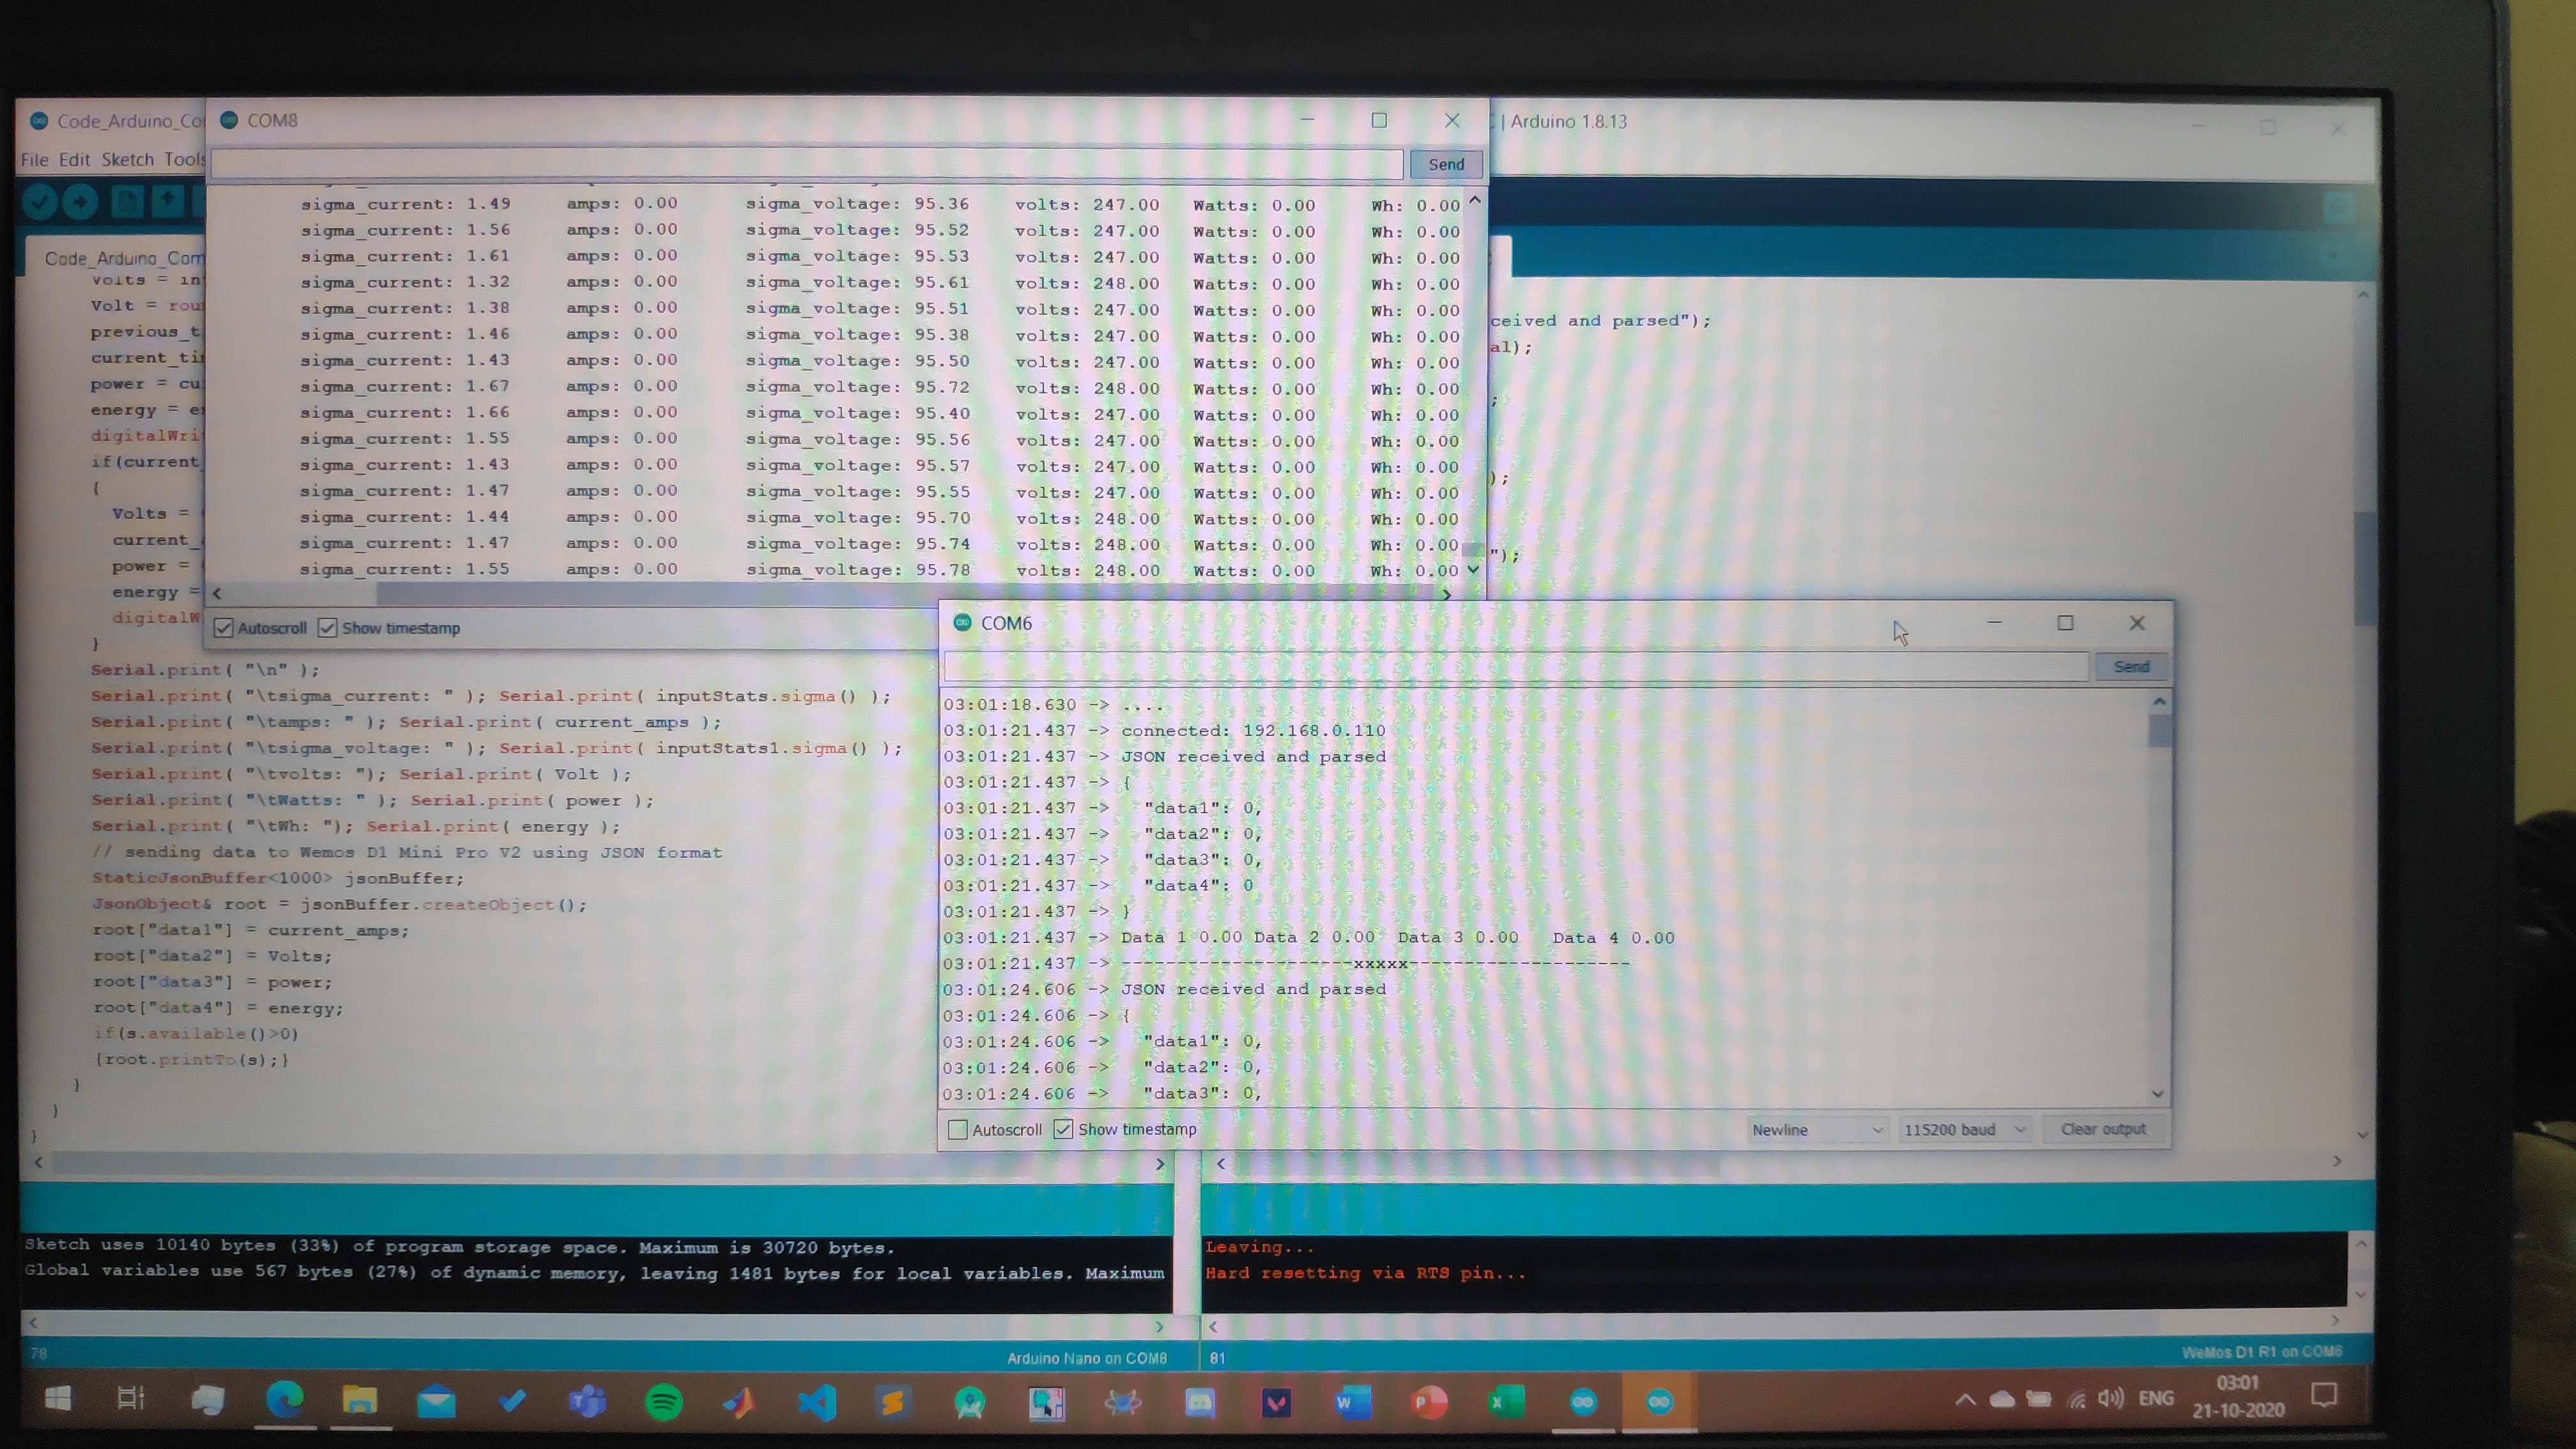
The data from the Arduino is sent to the node MCU in JSON format (JavaScript Object Notation) through serial communication. It is a format that uses key-value pairs just like a dictionary. JSON is platform-independent and is lightweight. Hence, communication between Arduino and node MCU becomes faster. Since the system works in real-time, it needs to run fast as possible.
Connecting an LCD to the circuit, dropped the voltage input to the sensor from 5V to 4.7V DC. Hence, there were significant errors in the data obtained. So, for now, we have removed the LCD screen from the circuit. To access the output values, we are directly using the serial monitor provided in Arduino IDE.


As of now the prototype can measure current and power of resistive loads on AC supply accurately as well as DC loads but that is not our goal. We are currently trying to design a circuit to measure power factor, so that we will be able to measure power drawn by inductive and capacitive loads. The final system will be able to measure current draw, power and energy consumption of all types of loads as well as power factor. The system will show the apparent power and the real power. Then we will expand this sytem to three phase systems and loads.