This question understanding system uses a free liscensed C&C parser developed by Dr. Stephen Clark at Cambridge University http://svn.ask.it.usyd.edu.au/trac/candc. Under the AskGraph home folder, binaries of the C&C parser is located in candc-1.00 folder with its liscence. The C&C parser is liscensed only to non-profit uses.
Do you have a question in mind that could be answered by a well-designed infographic, such as a bar chart or a line graph?
For example, if you ask the question “In 2014, how does the top 5 countries compare in terms of GDP?”, a bar chart ranking the GDP of United States, China, Japan, Germany, and France would be a great answer 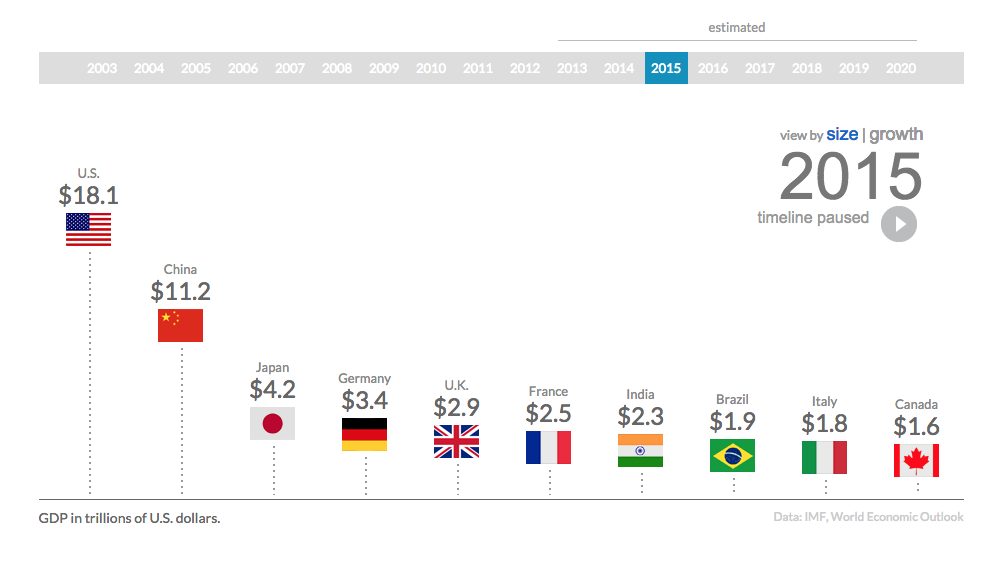
GraphicQuestion is an entity extraction and classification system for question sentences written in Python. Given a question sentence, GraphicQuestion first extract noun phrase entities, and then tells you what kind of infographic might answer your question. Under the home folder of GraphicQuestion, call python AskGraphMain.py "...your question here...?"
Example question input
python AskGraphMain.py “How does the GDP of the top 5 countries compare?”
Ask4Graphics Output
You want a graphic listing “the top 5 countries” according to “the GDP".
Ideal graphic X-axis should describe: the top 5 countries
Ideal graphic Y-axis should capture: the GDP
Ideal graphic should convey: max or min
Although there has been many entity extraction tools or parsers available, most are trained on narrative sentences form corpuses such as newspaper articles. Few parsers perform well on WH questions — How, What, Which, etc. I use an advanced statistical parser using the Combinatory Categorial Grammar (CCG), developed by **Dr. Stephen Clark ** at Cambridge University http://svn.ask.it.usyd.edu.au/trac/candc. This parser contain a model specifically trained for question sentence types, which out perform many well-known parsers, e.g. Stanford parser, on my graphic question corpus (all questions collected from human subjects are available here http://www.eecis.udel.edu/~zhuo/all_queries.txt.
GraphicQuestion also use Weka http://www.cs.waikato.ac.nz/ml/weka/ decision tree model to classify which axis each extracted entity should describe, and what the ideal graphic should convey. I have 3 trained decition tree models under folder weka-3-6-6/, they are: XYtree.j48.model, IMtree.j48.model, and FXtree.j48.model.