
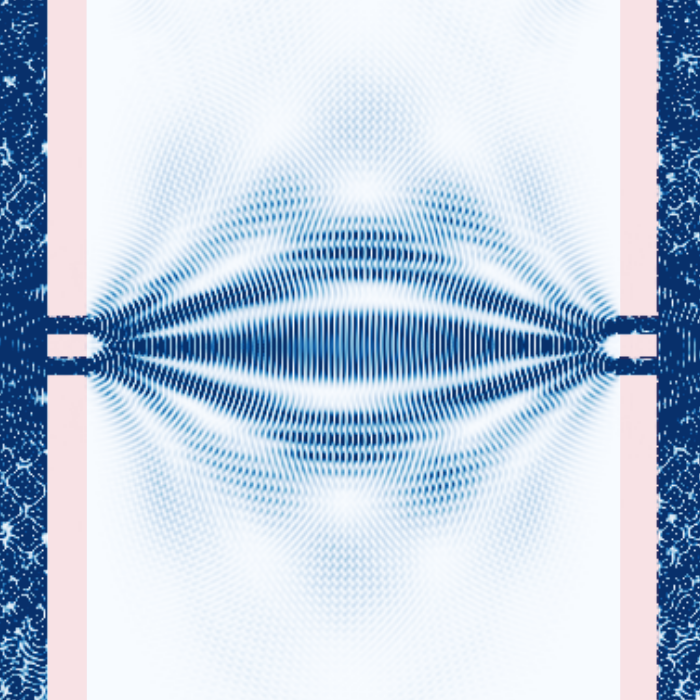
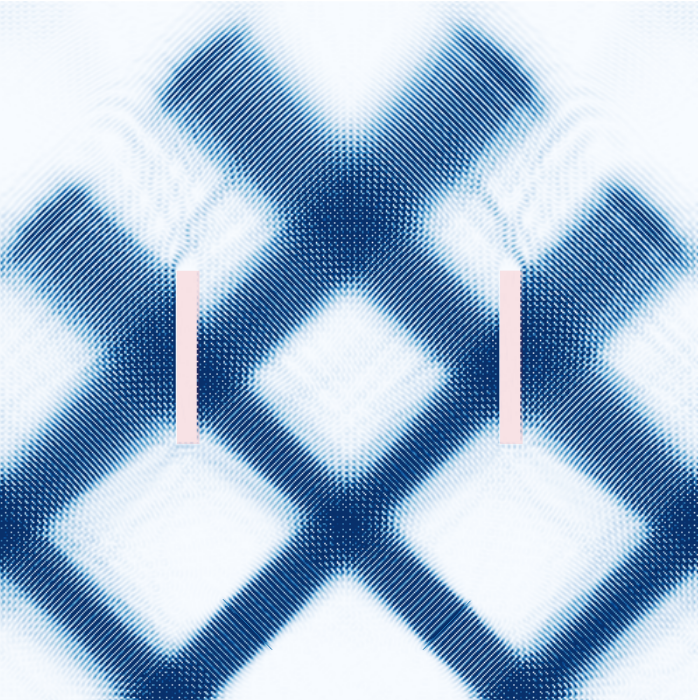
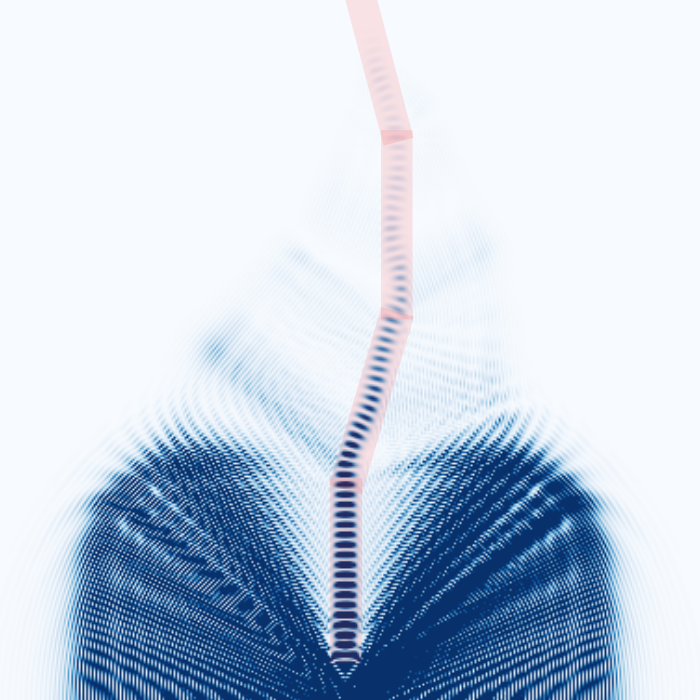
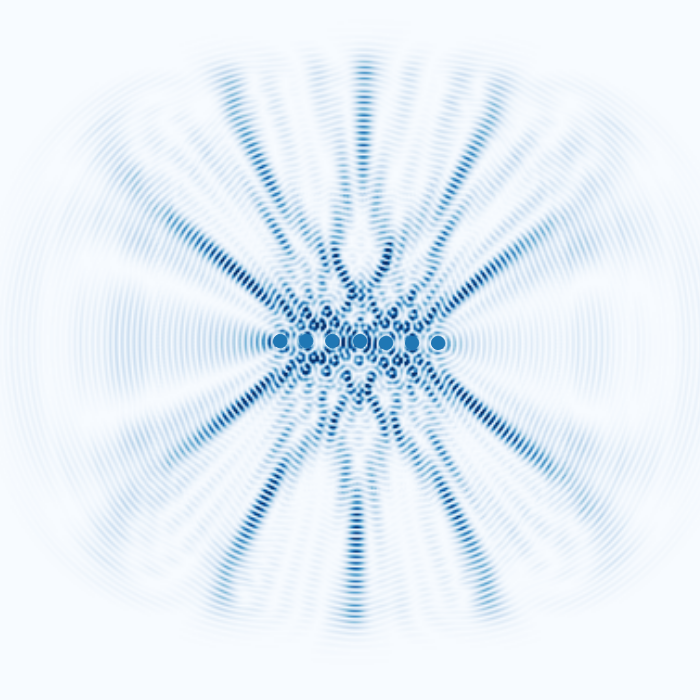
PhoSys is an open-source, web-based FDTD electromagnetic wave simulator. The project's primary objective is to assist teachers, students, and individuals interested in studying photonics or electromagnetic waves by offering a visualization tool for various electromagnetic phenomena in a simple and intuitive manner. Although the functionality is currently limited due to being in the early stages of development, you can still create visually interesting simulations using the three fundamental objects: point sources, line sources, and rectangle objects.
We decided to create PhoSys because one day, during a physics class about electromagnetic waves, our team had a discussion and couldn't agree on a certain question. We wanted to resolve this question by simulating the problem, but we soon realized that there weren't any easy-to-use tools available. The simulation tools we found were either too complicated and expensive, like Ansys Lumerical, or too basic and didn't allow us to check what we wanted, like the simulations provided by the University of Colorado Boulder.
A demo page is currently hosted on phosys.lv. No setup required.
Although mobile use is supported, it is highly recommended to use a desktop device.
To run this application, you'll need Node.js (which comes with npm) and Python 3.10+ installed on your computer.
Optionally you can use Conda to create an isolated environment with the command conda create -n phosys python=3.3.0 and activate it each time with:
conda activate
conda activate phosys
After cloning the repository open two terminals and run:
cd frontend
npm i
npm run dev
And:
cd backend
pip install -r requirements.txt
flask --app main.py --debug run
(npm i and pip install are only required to update/install)
The directory structure is very simple. All frontend code is in the frontend directory, all backend code is in the backend directory.
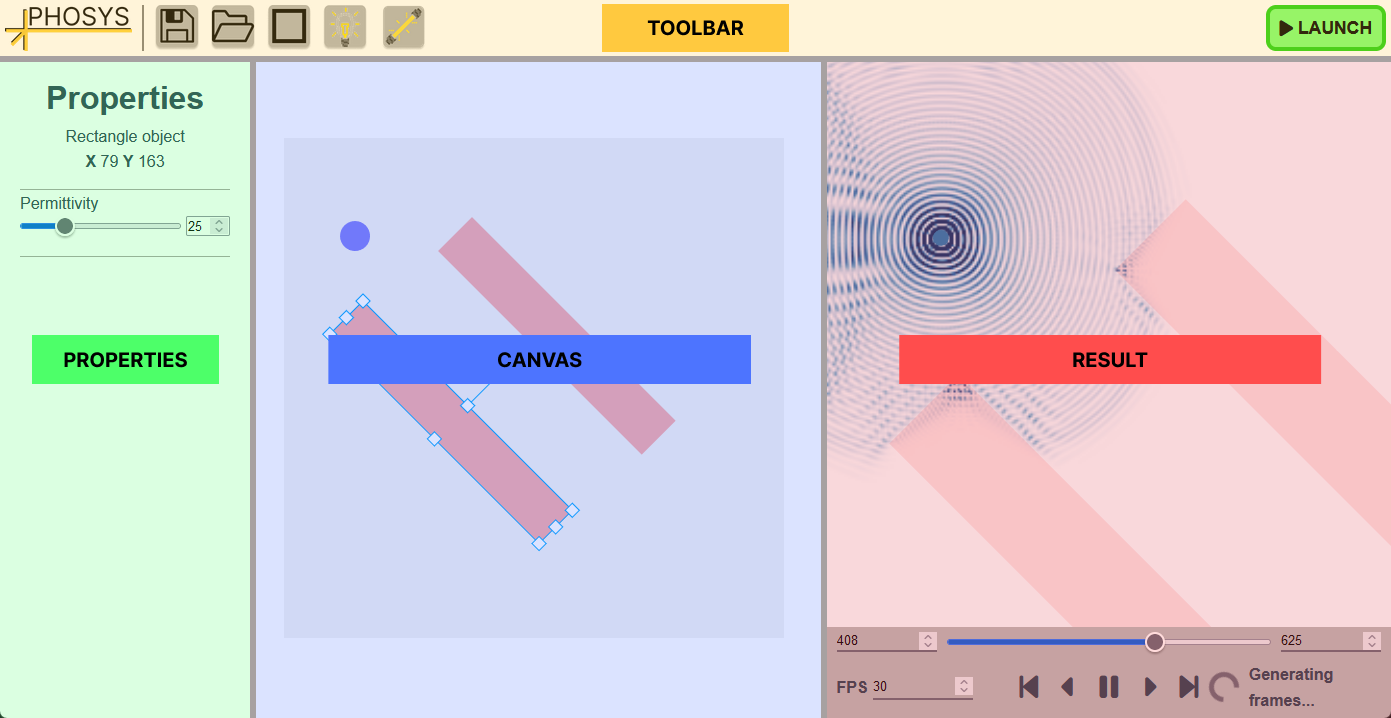
The PhoSys user interface consists of 4 main parts:
The interface was made with the VueJS JavaScript framework and the Vue Splitpanes component, which were used to create a responsive and modern UI with user resizable panels. Additionally, the Font Awesome icon library was used for some icons.
The UI is split up into 5 Vue components. Furthermore, there is a Vue component for each type of object in the shapes subdirectory.
App.vue- The main component that has the toolbar and all other componentsDraw.vue- The canvas component, this component also uses shape components from theshapessubdirectoryProperties.vue- The properties panel componentResult.vue- The component responsible for showing the result of the simulationSeekBar.vue- The component that has all of the controls for simulation playback
The toolbar contains useful icons for interacting with the canvas and simulation.
| Name | Icon | Description |
|---|---|---|
| Save icon |  |
Opens a dialog to save the current canvas objects in a JSON file to a local directory for later importing |
| Open icon |  |
Opens dialog to load simulation saved with the save icon |
| Rectangle object |  |
Adds a rectangular object to the canvas |
| Point source light |  |
Adds a point source object to the canvas |
| Line source light |  |
Adds a line source object to the canvas |
| Launch |  |
Sends a request to the server to start the FDTD simulation with the objects added to the canvas |
The properties panel lists all of the properties of the selected object or global simulation properties if a single object isn't selected. It also has additional information about the object, such as its position and name.
Here is a list of all the properties that are currently editable by the user:
- Permittivity
- Permeability
- Permittivity
- Conductivity
- Wavelength
- Amplitude
- Phase shift
- Wavelength
- Amplitude
- Phase shift
This is the most important part of the PhoSys user interface. The simulation canvas is used for adding objects to the simulation, all objects placed in the grey canvas rectangle will be simulated.
Here is a list of features the canvas editor currently supports:
- Scene navigation (pan and zoom with left-click and scroll wheel)
- Multi-touch zooming on mobile
- Object adding and deleting with Del
- Multi-object selection while holding ⇧ Shift
- Object transformation (moving, scaling and rotating)
- Incremental object moving with arrow keys
- Rotation snapping while holding Ctrl
- Object copy/paste with Ctrl + C and Ctrl + V
PhoSys uses the Konva.js JavaScript library to draw objects to a canvas. Konva additionally provides an easy way of adding object transformation control, but all other features had to be added on top.
All information necessary to draw and simulate an object is stored in a JavaScript object called data defined in the data.js file. This object also contains information about global simulation properties.
Whenever a shape icon in the toolbar is clicked, an object from the defaultObjects.js file is added to the shapes array in the data object. The Draw.vue component passes shape properties from the shapes array to their respective shape components. Each of these components update their respective properties after they have been transformed in the Konva canvas to ensure the data accurately represents what is being shown on the canvas.
All shapes have a property name that allows them to be uniquely identified in the canvas. Each shape also stores information about their properties, which gets displayed in the properties panel.
Storing the information about objects in this centralized way allows for easy loading/saving of canvas objects and a simple way to send object information to the server without including any unnecessary data.
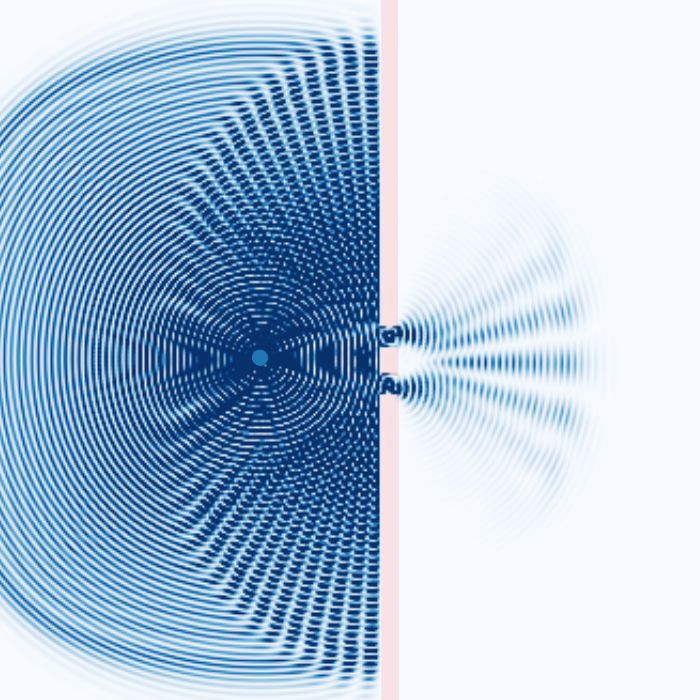
This panel is used for displaying the result of the simulation received from the server.
The client receives a matplotlib graph of the result, which gets converted to HTML with the mpld3 library. The result canvas supports zooming and panning. The frames of the result of the simulation are saved in a local array.
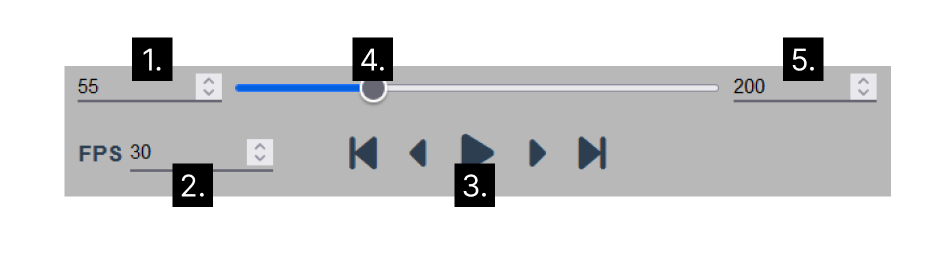
- Current frame number
- Simulation playback framerate (experimental)
- Playback controls. From left-to-right:
- Go to beginning
- Previous frame
- Play/pause
- Next frame
- Go to end
- Seek bar. Used for scrubbing through the simulation. Because the simulation generates sequentially, you can only seek to already generated frames
- Final frame number. Determines the final frame to which the simulation will generate. This can be set manually or by pressing play again after the simulation reaches the final frame, in which case it will keep generating forever
The backend uses the Flask python web framework and the Socket.io library to make an API that continuously sends data to the client with the WebSocket API. Additionally, uWSGI is used to serve this API and nginx is used for routing. The whole application is containerized with Docker and Docker compose. The API is hosted on Cloudflare.
When the server receives the JSON object with the information about placement of objects, it parses this data and starts the FDTD simulation. As mentioned before the server uses an electromagnetic FDTD simulation based on Flaport's fdtd library. More information on how the simulation works is available on the library's GitHub page.
The simulation generates a matplotlib graph that contains representations of scene objects and sends it to the client. When the client sends a socket message to generate a certain number of frames, the server continuously starts sending the results of the electromagnetic simulation as Base64-encoded images.
PhoSys is currently in development, so bugs and other issues are to be expected. Known bugs:
- Placing objects outside of the grey canvas box will give errors
- Simulation result playback is sometimes unstable
- Placing objects on top of each other sometimes causes problems
Some of the features we plan to add in the future:
- More advanced shapes (polygons and curved surfaces, so lenses could be simulated)
- More precise control over object positioning, ability to set defined size and position
- Result exporting to mp4
- Setting a pulse to source objects
- Signal detectors
- Unit of measurement selection for properties
- Improved UI with windowing system
- Ability to change simulation resolution/canvas size
- Ability to run the simulation locally with WASM and WebGPU
- More visualization tools
- Ability to hide objects in the results panel