


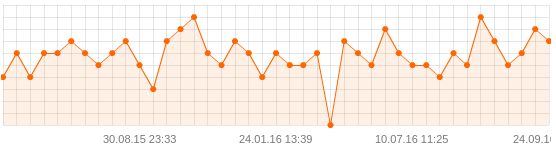
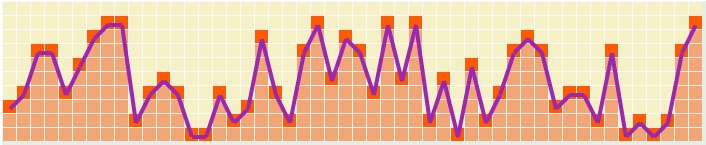
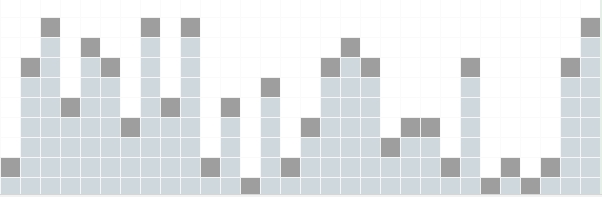
React.js plugin for building a linechart. Bar chart, calendar view visualisation. Diagram, graph, pyramid visualisation of large datasets. Showreel. The source for this module is in the main repo. Please create issues and pull requests. Check angular-scale if you're using Angular.js. And jquery-linechart if you're using JQuery.
Inspired by kinopoisk.ru chart written using Adobe Flash. Feel free for contribute.
npm install chartify
import Chartify from 'chartify';<Chartify data = {this.items}
width = {50}
height = {10}
boxSize = {16}
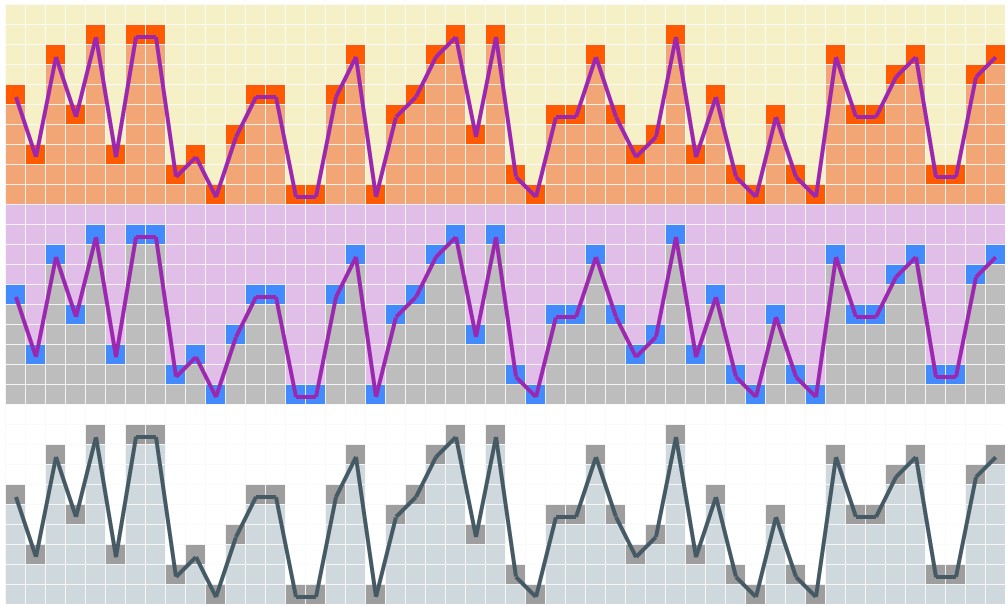
line = {true}
theme = {"purple"} />- data is an array of objects [{value: 0}, ... , {value: 10}]. This is the dataset of the chart.
- width is the horizontal length of the data array. If width param is less than the length of the data array then user will see the last values of the data array.
- height is the vertical length.
- box-size is size of each box in pixels.
- line is param that determines if this is a line-chart.

- theme is color scheme of the chart.
Please check the example folder to see how it's going on practice.
- default
- purple
- grey
Copyright (c) 2016 Kirill Stepkin
