Project Outline:
Topic: World Happiness Report 2021
Reason why we selected our topic:
Our team explored various data sets such as Olympic data, Zillow housing data, NBA player statistics and the World Happiness data.
As we chatted about what insights we could gain from the analysis we decided the features and information available within the World Happiness data was what we wanted to explore.
Description of source data: The World Happiness Report 2021 focuses on how people all over the world have coped with the effects of COVID-19. The data set has two focuses, first the effects of COVID-19 on the structure and quality of people’s lives, and second to describe and evaluate how governments all over the world have dealt with the pandemic. The purpose of the data is to help to try and explain why some countries have done better than others.
Questions they hope to answer with the data: By applying the most advanced techniques of Machine Learning, it would be possible to define the most important factors and measure quantitatively their contribution to one’s happiness.
Our team is hoping to apply advanced techniques with Machine Learning to define the most important factors to measure and compare and enhance countries happiness scores.
We are also looking into other measures not explored in the happiness dataset to see what kind of correlation other factors might have with the happiness data.
Description of the data exploration phase of the project: We took several different data sets that reported their data by country and loaded them each into their own postgres SQL table.
Description of the analysis phase of the project: In SQL view to check how each country was reported in each data set to check for spelling differences or abbrivations. After identifying the different ways a country was referred to we created a cross reference table that we could join each of the data sets to. Then we combined all the datasets in a view that could be used when creating the machine learning model.
Technologies, languages, tools, and algorithms used throughout the project:
Languages: PostgreSQL; Python; R
Tools: PostgreSQL; Amazon RDS; Tableau; Google Slides; Jupyter Notebook; Slack; Excel
Algorithms: Decision Tree; Random Forest; Multiple Regression; SMOTE
Slides - Presentation is drafted in google slides: Presentation Draft
Description of preliminary data preprocessing:
- CSV files were imported into Jupyter notebook
- All column headers for each CSV file were reviewed, if column names containing same variable did not match between files, this was corrected.
- All variables under “country_name” were reviewed. Country names that appeared multiple times were reviewed, any country names with slightly different spellings were corrected.
- Missing Region info for countries were researched and added to designated columns in each file.
- After all tables were combined into one master dataset table, Jupyter notebook was utilized to determine column NA count. All columns that had over 50% missing values were removed.
- All rows still containing missing values in the master dataset table were also removed.
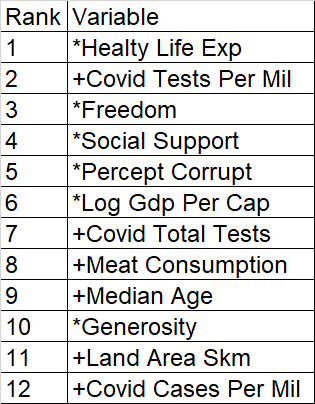
- Random Forest was used to narrow the total variables down to the top 12 variables that impact happiness scores the most.
Description of preliminary feature engineering and preliminary feature selection, including the decision-making process:
- The target for the machine learning model is happiness scores, this is labeled as “ladder_score” in the analysis
- Random Forest was chosen to narrow down the number of variables to the twelve most impactful for happiness scores. The below were listed as the top twelve.
- For this analysis, three machine learning models were chosen: Multiple Regression, Random Forest, and the decision tree. The goal is to see which model predicts happiness scores accurately while also figuring out which variables are statistically significant in the analysis.
Description of how data was split into training and testing sets:
- Multiple Regression and Random Forest: Default parameters were used to split the data into training and testing sets
- Decision Tree: 80% train and 20% test
Explanation of model choice, including limitations and benefits:
-
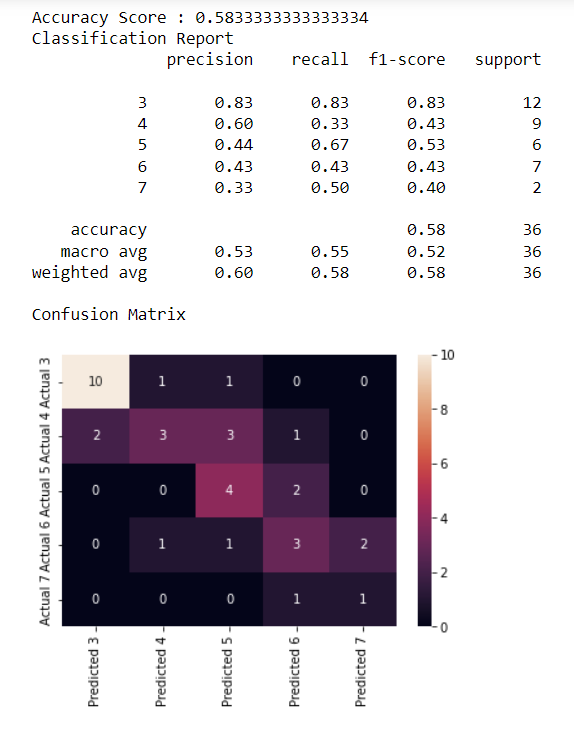
Our first attempt to create an accurate predictive model involved the use of the decision tree. At first the default parameters for splitting the data (75% train and 25% test) were used. However, this produced a very low accuracy score. The model was then rerun with splitting the data between 80% train and 20% test. This did increase the accuracy score slightly to 40%, however, this may cause an overfitting issue when running the same predictive model on new data. For the third attempt at increasing the accuracy for the decisions tree, we used SMOTE to attempt to correct the imbalance in the dataset prior to re-running the model. Model split did not change (80% train and 20% test). This did bring the accuracy score to 58.3%. The confusion matrix below shows our model is best at predicting happiness score of 3 correctly but struggles the most with predicting happiness score of 7 correctly.
-
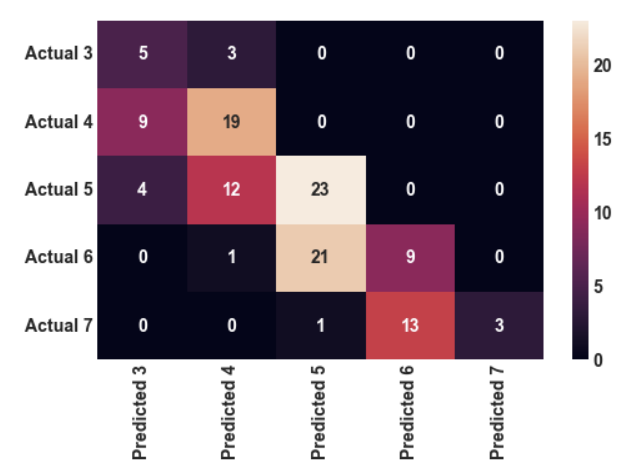
Since the decision tree shows a very low accuracy score, this may be an indication of a week model due to the dataset being too small. To account for this issue and attempt to strengthen the model, Random Forest was chosen to be our next predictive model. Prior to balancing the data by using SMOTE, the accuracy score was 45.4%. When running SMOTE prior to running the Random Forest model, the accuracy score jumped up to 67.0%. The confusion matrix below shows our model is best at predicting happiness score of 3 and 4 correctly. However, for this model only one actual happiness score of 4 was used for this predictive model. Because of this, I would be cautious with attempting to predicted actual happiness scores of 4 correctly when using this model.

-
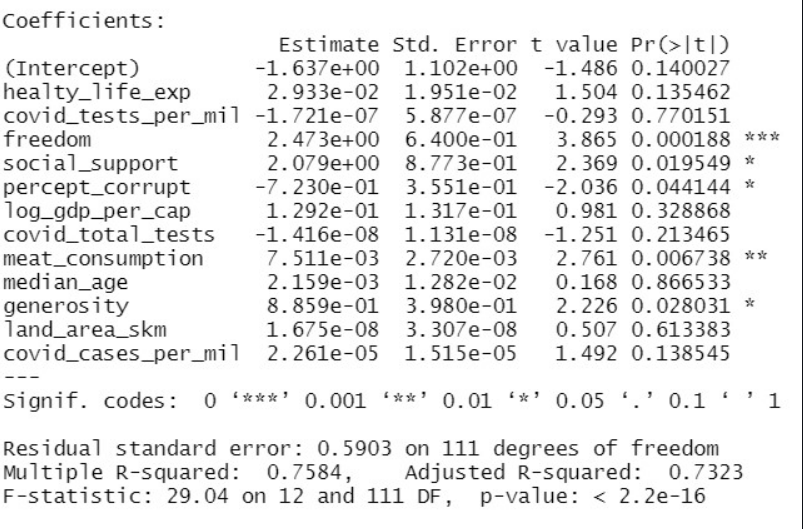
To see if we can find a model that is even more accurate, R was used to create a predictive model using multiple regression. Default perameters were used to split the data between train and test. Our final predictive model for multiple regression shows an accuracy score of 75.8% with five variables being statistically signification: freedom, social_support, percept_corrupt, meat_consumption and generosity. Between the three models, multiple regression is the best predictive model to predict happiness scores. The confusion matrix below shows our model is best at predicting happiness scores of 4 and 7 correctly. This model struggled the most with predicting the happiness score of 3 correctly.
Description of interactive element(s):
-Filters for Region and Country Name are in the top right of each Dashboard
-Additional Filtering is available on the Map, bar graph and the Ledged of the Scatter plots
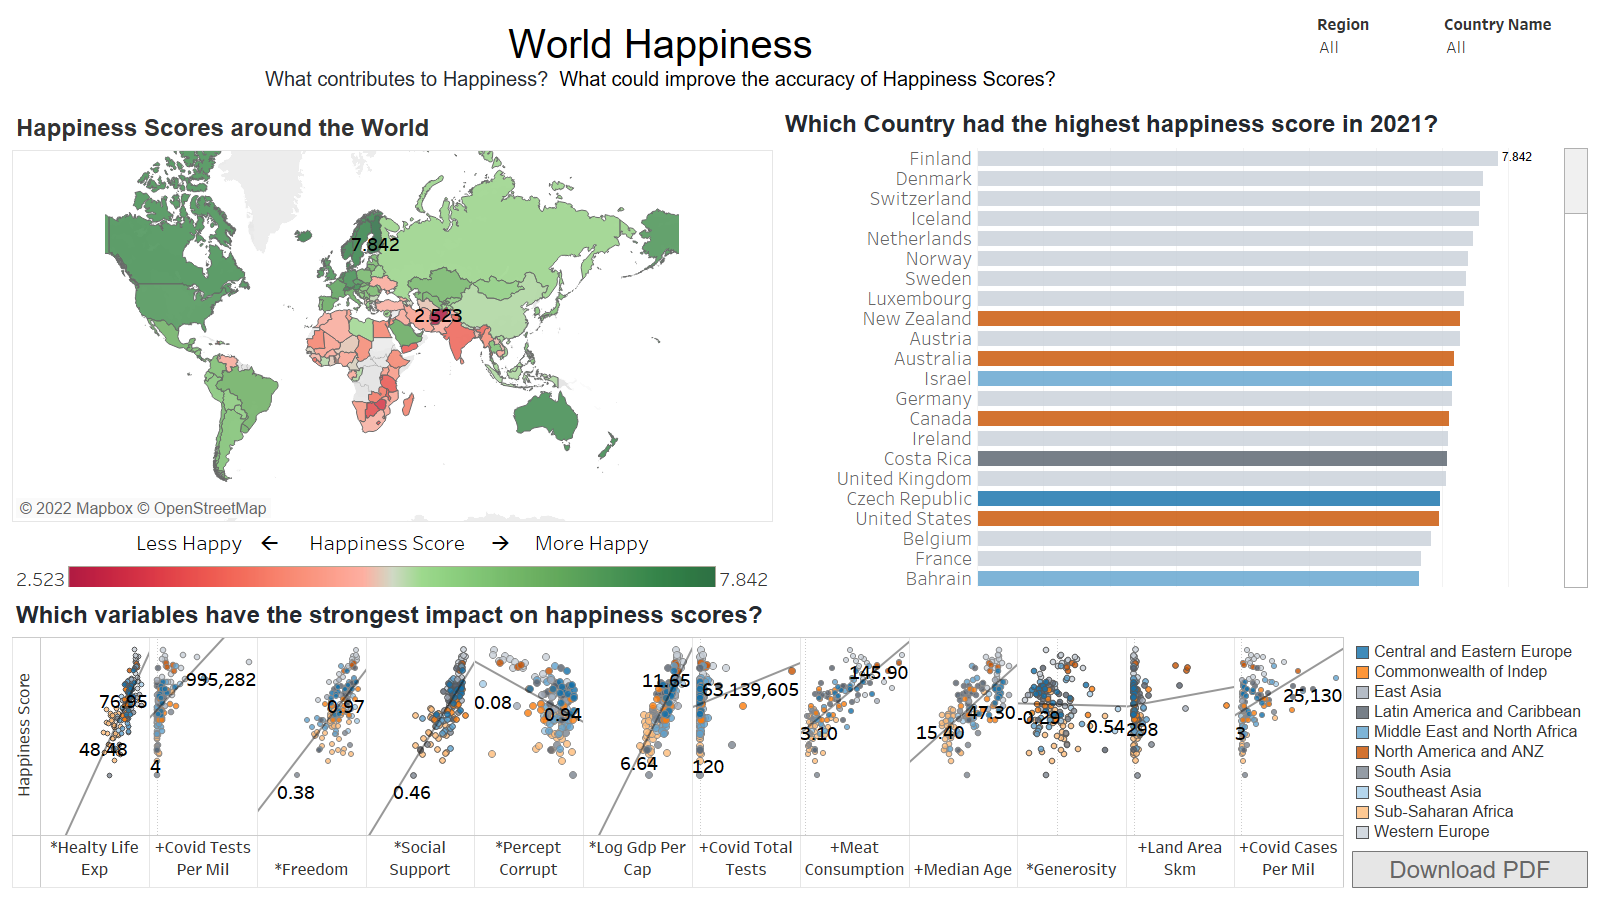
- Happier countries had...
- Less screen time
- Higher female alcohol consumption
- Higher covid test availability but also more cases
- Higher median age
- Surprises
- Generosity and Suicide rate didn't seem to have much correlation with happiness
- We could explore additional machine learning models
- Additional data sets:
- Average nightly hours of sleep
- Literacy rates
- Pet ownership percentages
- Social media adoption
- Build the database portion in MS SQL Server for ease of use
- Find larger, more complete datasets. We could possibly include additional years to increase dataset size as well.
Data Sources:
- World Happiness Data
- Covid Data
- Alcohol Consumption by Country
- Meat Consumption, Median Age, Suicide Rate
- Land Use and Density
- Average Screen Time
Machine Learning Code Rescources:
- https://statisticsglobe.com/plot-predicted-vs-actual-values-in-r
- https://www.kaggle.com/code/rafjaa/dealing-with-very-small-datasets/notebook
- https://www.stackvidhya.com/plot-confusion-matrix-in-python-and-why/