Requires Python version 3.5 or later
This command line tool takes a csv file of data and displays a savable matplotlib graph of the source dataset and integrated dataset. Only a file is required input for the program to run.
-
- A CSV file containing at least two columns of data:
- One to represent the period of data (time, days, weeks, etc.) [X-values]
- One to represent measured values that occurred at each period [Y-values]
If your dataset has more than two columns, you can specify which column represents the x-values and y-values using the
-i, --intervaland-d, --dataflags respectively.If no columns are specified, the 0th and 1st column will be used. If the column representing x-values is a non-numeric value, an auto incremented sequence will be provided instead:
- E.g: 1/1/22, 2/1/22, 3/1/22 becomes 1, 2, 3
- A CSV file containing at least two columns of data:
-
- Source Graph Configurations - A pipe delimited string to specify configurations for the graph of source data - "XLABEL | YLABEL | TITLE | COLOR"
- E.g:
"Days|Earnings|Earnings by Day|Red"
- E.g:
- Integrated Graph Configurations - A pipe delimited string to specify configurations for the graph of integrated data - "XLABEL | YLABEL | TITLE | COLOR"
- E.g:
"Time|Cummulative Earnings|Cummulative Earnings Over Time|Green"
- E.g:
The string should be enclosed with double quotation marks. If any of the values provided are invalid, the matplotlib default or None will be used.
The strings are stripped of white space, so
" Days|Earnings | Earnings by Day | Red"is functionally identical to"Days|Earnings|Earnings by Day|Red".Partial configuration strings should still include a pipe character:
- E.g:
"Day|Coding Hours| |"sets the xlabel and ylabel but leaves the title and color defaulted
Ordering is important for parsing the configuration string. The ordering of "xlabel | ylabel | title | color" must be preserved.
- Source Graph Configurations - A pipe delimited string to specify configurations for the graph of source data - "XLABEL | YLABEL | TITLE | COLOR"
The Example dataset on Covid Data in the US since 2/29/2020 can be found in the root directory of this repo.
-
py main.py -f ..\example.csv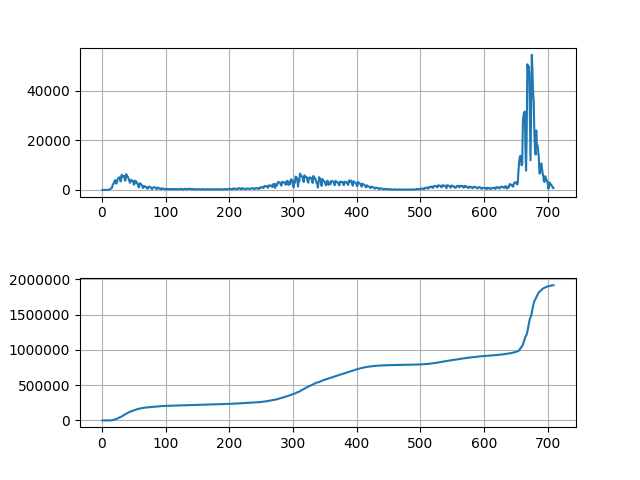
-
py main.py -f ..\example.csv --source_graph "Day|Confirmed Cases|United States - New Covid Cases Per Day |orange" --integrated_graph "Time|Cummulative Cases|United States - Total Covid Cases|red"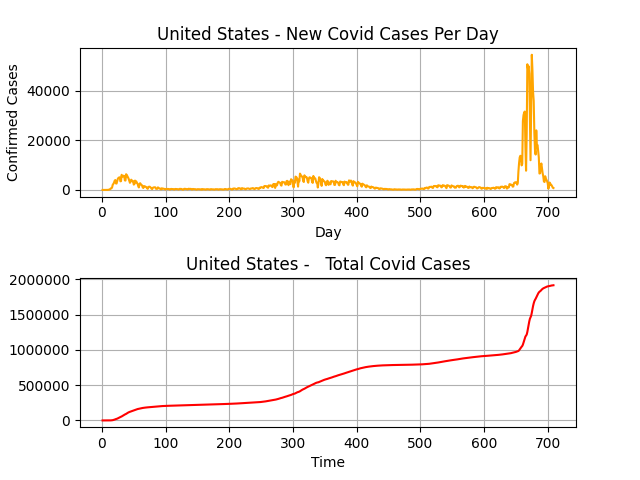
-
py main.py -f ..\example.csv --source_graph "Day|Deaths|United States - Covid Related Deaths Per Day |notarealcolor" --integrated_graph "Time|Total Deaths|United States - Total Covid Related Deaths|black" -i 0 -d 4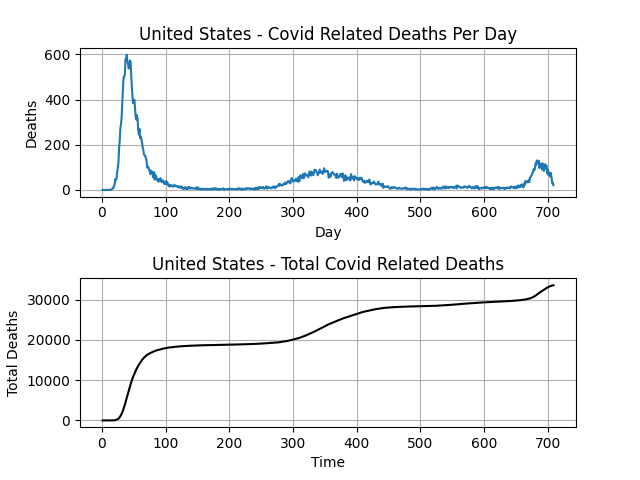
For the --source_graph arg in Example 3, the color provided doesn't exist, so the matplotlib default color was used instead.
- -h, --help show this help message and exit
- -f FILE, --file FILE data file path (required)
- -d DATA, --data DATA column of measured values (optional). Defaults to
column 1 (0-indexed) - -i INTERVAL, --interval INTERVAL column to represent the period of the data (optional). Defaults to column 0 (0-indexed)
- --source_graph SOURCE_GRAPH "XLABEL | YLABEL | TITLE | COLOR" for the source data graph separated by the '|' character (optional)
- --integrated_graph INTEGRATED_GRAPH
"XLABEL | YLABEL | TITLE | COLOR" for the integrated
graph separated by the '|' character (optional)
- Add the ability to slice rows - E.g: rows 0-50 only or rows 0-50 with a step of 2
- Add support for integrating with respect to multiple columns
- Add additional configuration options for graphing, especially for displaying non-numeric x-values (2/29/2020 instead of 1)