This git repository has the main functions I use to analyse DArTseq data for ReCER. I have formatted it so that the analyses are split into individual R files so that they can easily be navigated through. These files will have to be modified if you intend to use them with your data, but they provide a scaffold for the analyses and plots that I usually create.
I've formatted the process into R files which focus on one analysis at a time. This makes particular plots or calculations easy to find in the git repository, however to use them they will need to be combined into a single document. I recommend that you download the first file (1 data import and qc.Rmd) and then add the subsequent code that you want to use as chunks. The R files are numbered in the order that I would usually run them, however this can change depending on your data and goals. Below you will find a summary of what these files are.
You will have to set up your directories in a specific way for this to work, as per the original ReCER method. For example, if I'm working with the species Zieria obcordata I would have the directories set up as:
--ZierObco
  |-- Analyses.Rmd
  `--ZierObco
    |--dart_raw
    |   `-Report_DZ22-7321_SNP_mapping_2.csv
    |--meta
    |   `-ZierObco_DZ22-7321_meta.csv
    |--popgen
    `--outputs
Where Report_DZ22-7321_SNP_mapping_2.csv is my DArT data and ZierObco_DZ22-7321_meta.xlsx is my metadata.
The metadata file has four compulsory columns (sample, site, lat, long), plus any additional data you wish to use. I would recommend having a species or "sp" column as well. You do not need to leave any cells intentionally blank as with the previous ReCER protocol, as any unwanted samples can be removed during the R analysis by whatever condition you're interested in.
- imports DArT data and metadata
- filters low quality and fixed loci
- sets working directory and major packages
- groups samples my geographic distance into "sites"
- good for large or complicated data sets
- not necessary if you already have clear sites
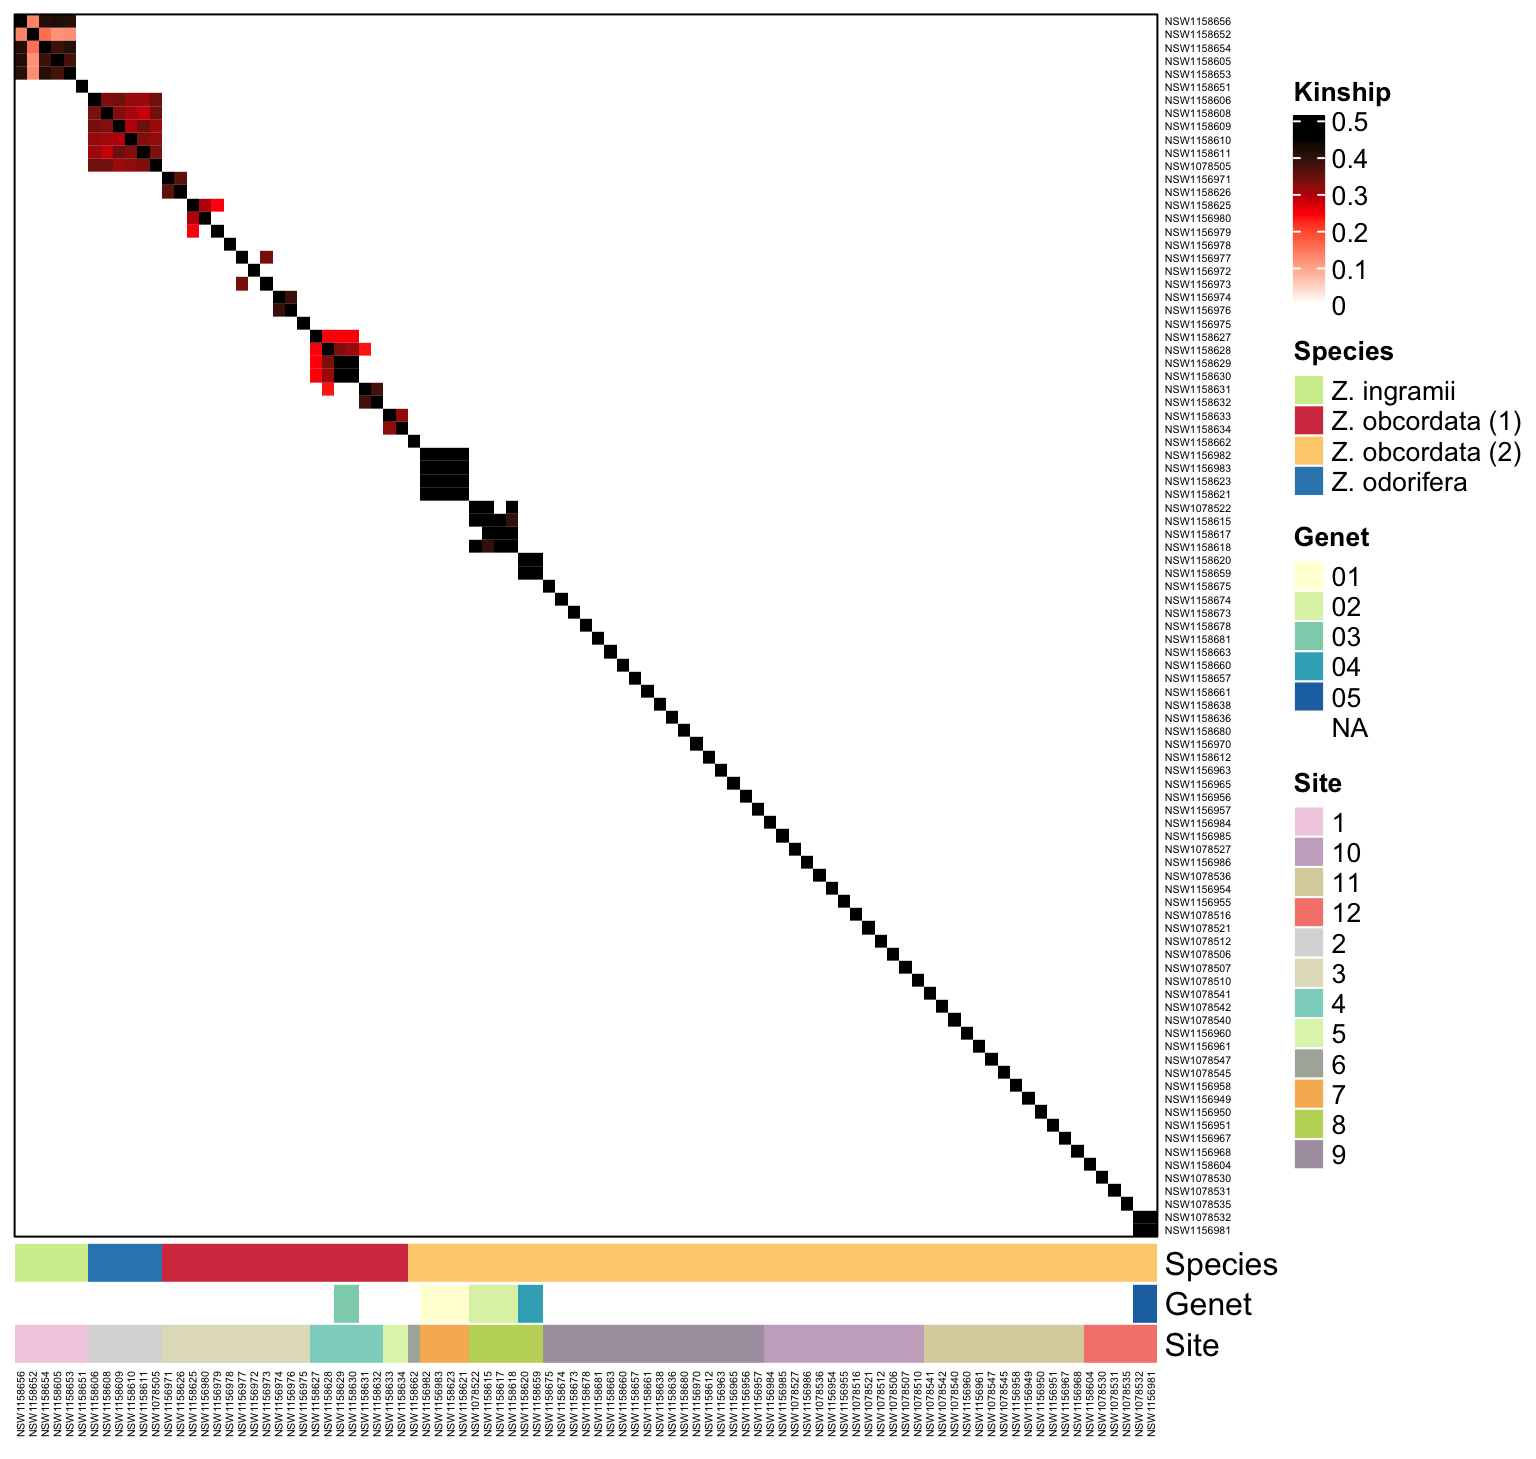
- finds individuals that are clones (kinship>0.45) and removes them from the working dataset
- calculates kinship between individuals and plots it with ComplexHeatmap
- both SNPrelate and popkin package methods are covered
- runs and plots the results of the dimensionality reduction methods PCA and UMAP
- needed to identify trends in the data and genetic groups
- accurate identification of genetic groups is important for selecting the grouping variable in kinship, FST, and diversity statistics analyses
- makes output file for visualisation of phylogenetic network in SplitsTree desktop
- makes output file for SVDquartets analysis in PAUP -- bootstrapped tree with SNP data
- calculates heterozygosity (HO, HE), inbreeding (FIS), and allelic richness (AR) of groups of individuals (usually sites)
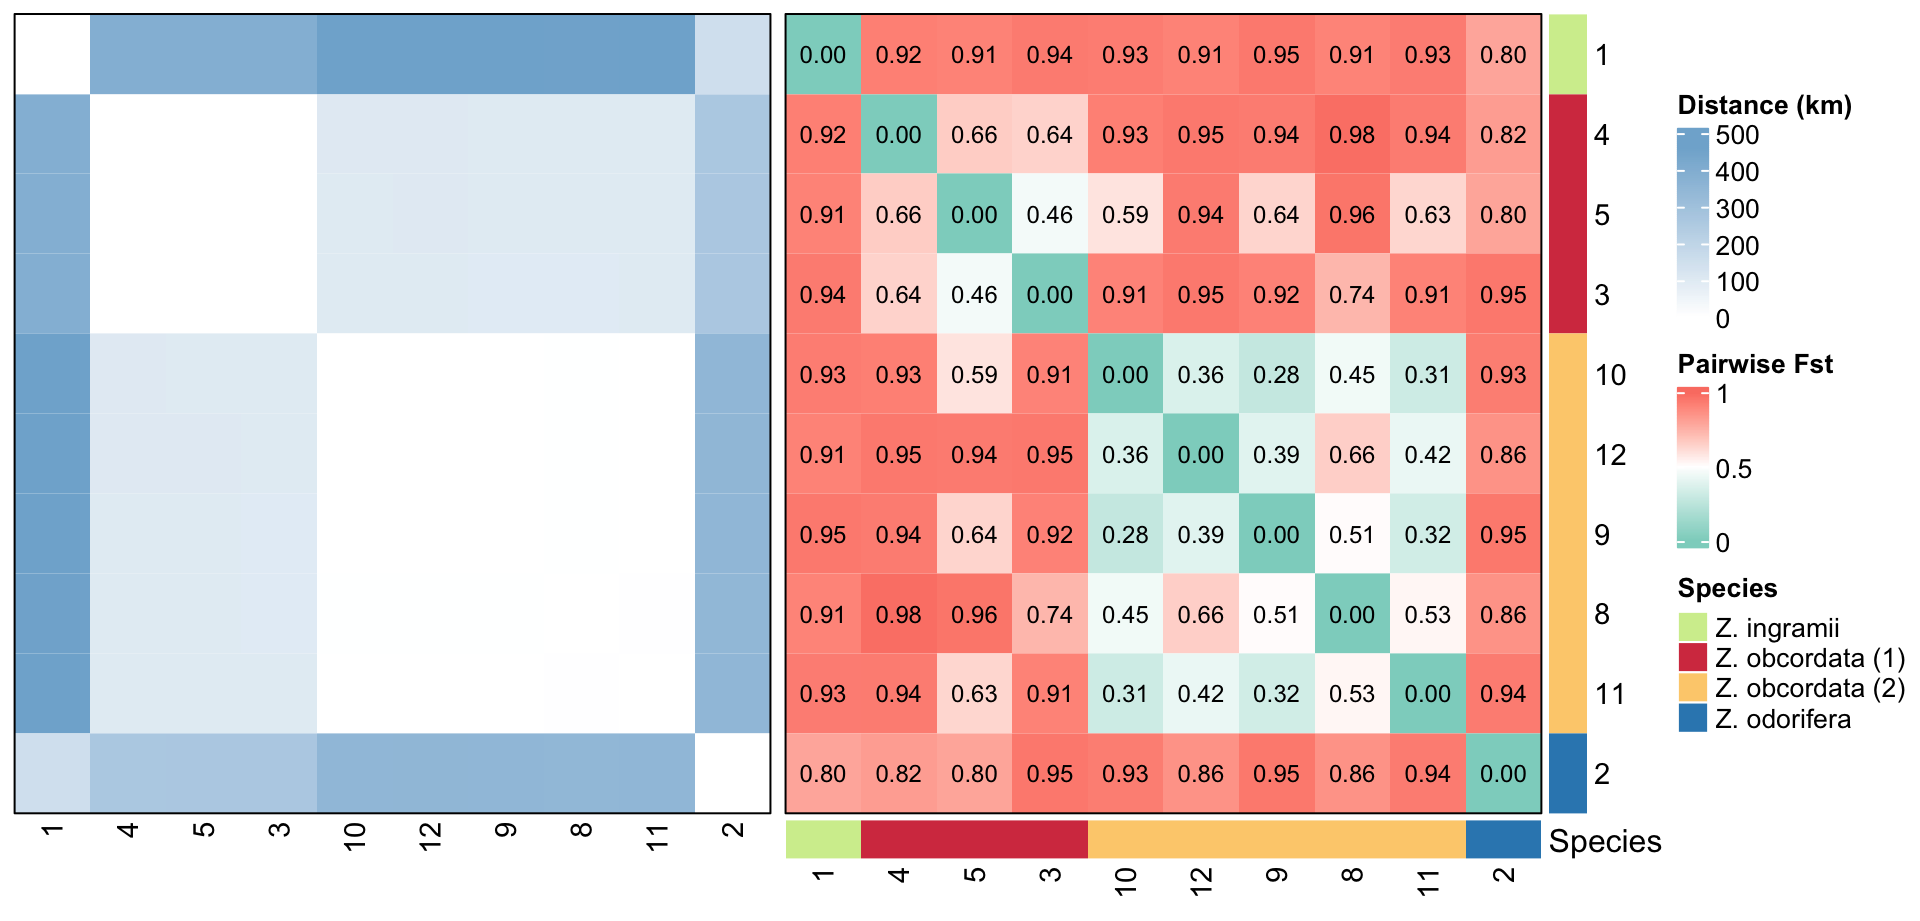
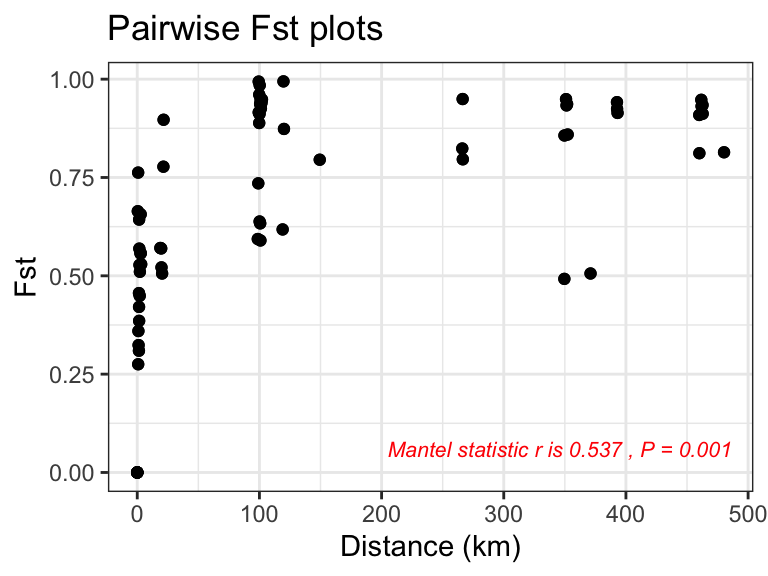
- calculates FST and geographic distances between groups of individuals (usually sites)
- tests the significance of the association between FST and distance using mantel test
- returns heatmaps of FST and distance
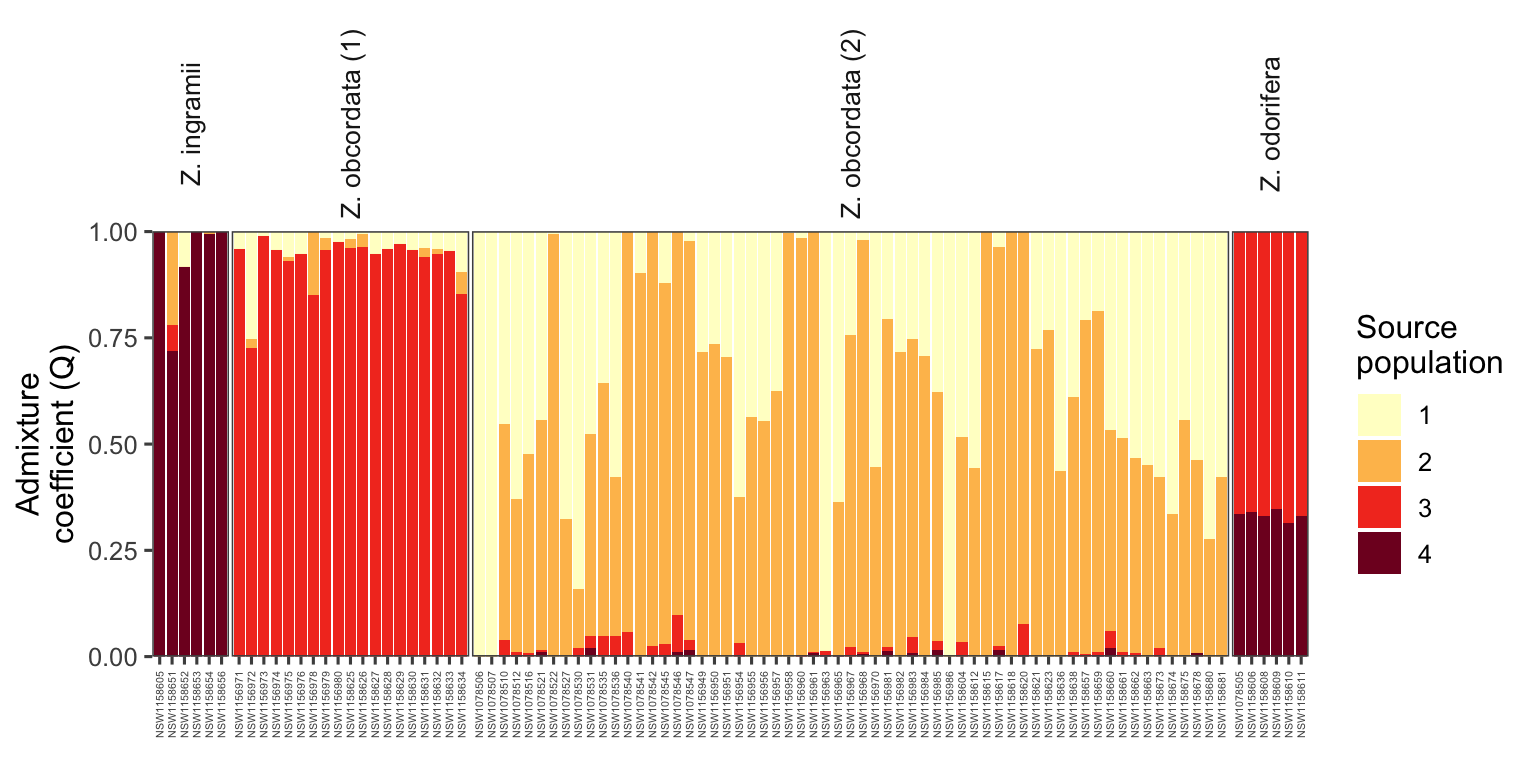
- predicts the ancestry of individuals
- returns admixure plot and scatterpie plot
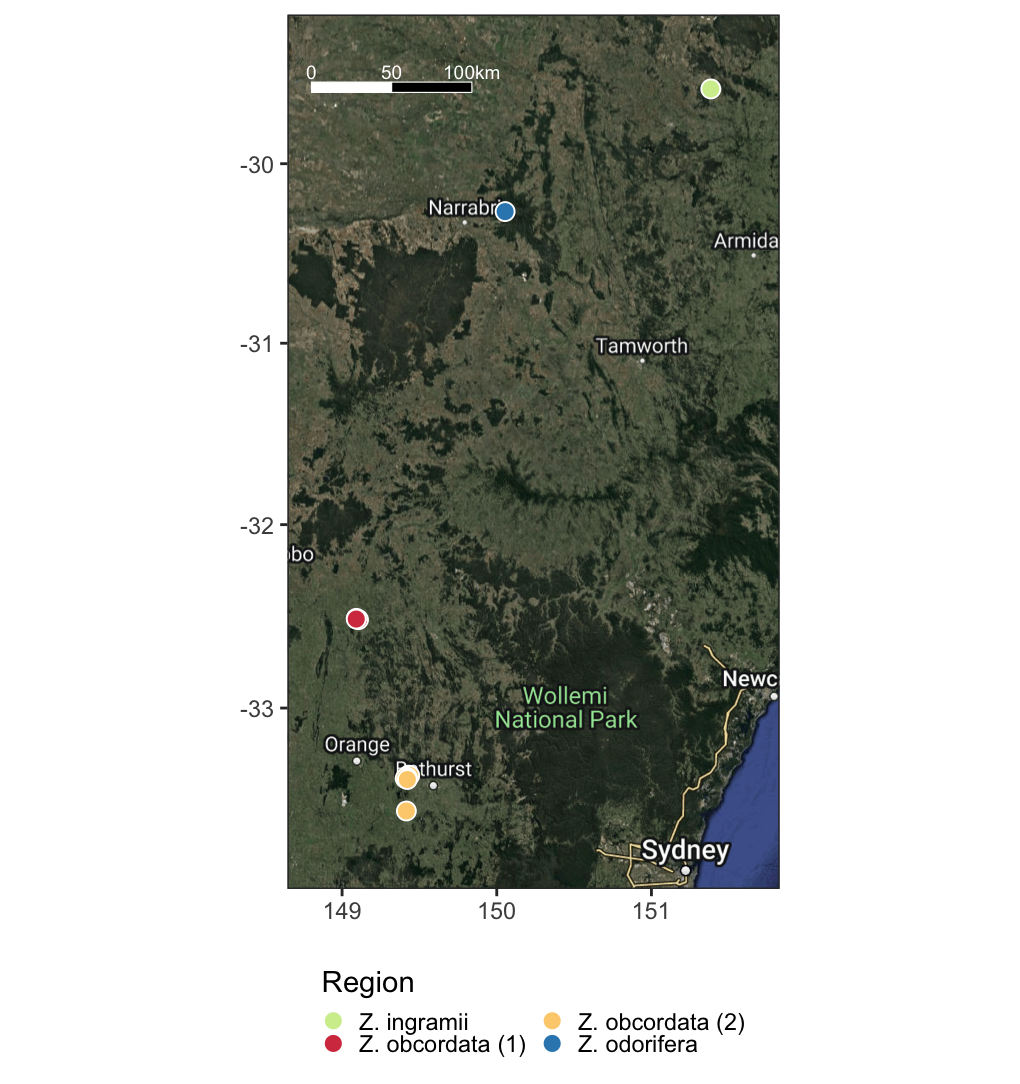
- plots a basic grey geographic map with the sites
- guidance on how to make satellite map with sites
- only usable for data with seedling and mother relationships
- determines how many alleles are impossible for the seedling to have based on the mother's alleles
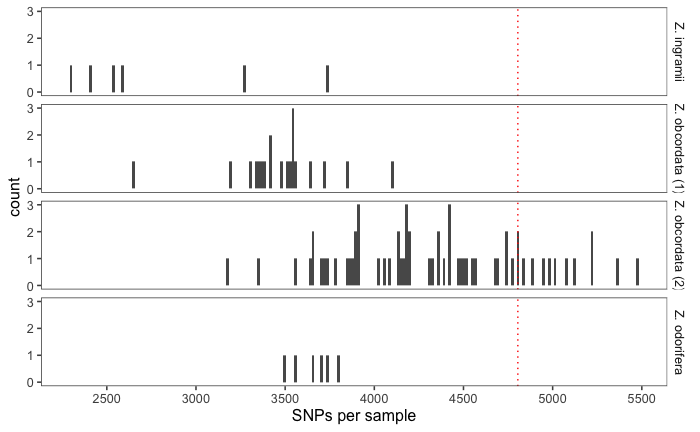
- uses readcount data file supplied by dart
- makes histograms of the readcount data which can sometimes be used to determine if individuals or groups of individuals have poidy variation
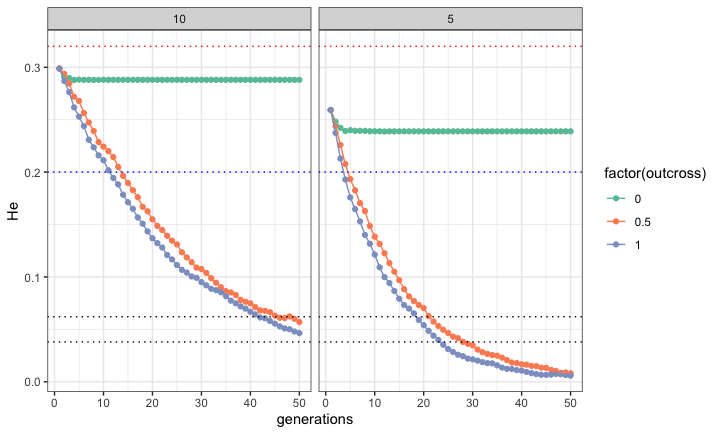
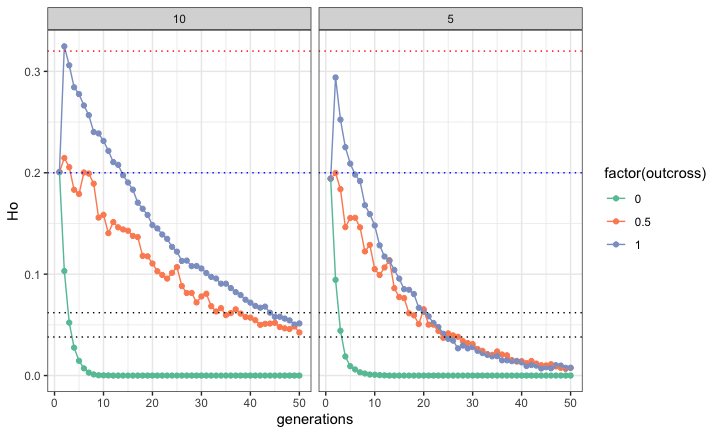
- makes a model population with specified number of individuals, loci, He, and Ho
- simulates that population breeding for n generations with specified outcross rates
- returns He and Ho for each generation