
Image Source: Forbes
A major league franchise has to consider many factors for success. Like any other business, a major league baseball team operates similarly. For many teams, success begins and ends with the construction of a roster under a budget and translating a roster of players into a championship caliber team. So how does a team decide how much they should be allocating their budget and constructing their roster of players? What are the keys to winning?
Building a competitive team facing a limited budget is a predicament many MLB teams face. There are the big market teams like the New York Yankees, Los Angeles Dodgers, and Boston Redsox that are allowed a larger budget than most other teams. How can the smaller market teams even compete when they can't afford the superstar players to help with winning? This is the foundation of Michael Lewis's Moneyball: The Art of Winning an Unfair Game and the inspiration for this project.

The goal is to construct a machine learning model that can predict the salaries of MLB hitters and pitchers using historical baseball data collected from the last 20 years. Additionally, we want to better understand which statistics in baseball contribute the most to winning.
Using these models, we can better understand the value of the baseball player and identify which players are potentially undervalued or overvalued when constructing a roster of players.
Web applications were constructed and deployed locally using Streamlit to predict batter and pitcher salaries.
Applications: Batter Predictions, Pitcher Predictions
Below is a sample tutorial of the web application in action and predicting a player's salaries using custom inputs. Additionally, 2022 statistics were input into the models to predict current expected player salaries for the 2022 season.
predict_vid.mov
Baseball player and team data was sourced using the PyBaseball package which allows users to scrape Baseball Reference, Baseball Savant, and FanGraphs data. For this analysis, data was collected from Baseball Reference and FanGraphs.
For a comprehensive list describing all the features/statistics in this notebook; refer to the following documentations links:
A total of 6 datasets were scraped, cleaned, and formatted for modeling and consist of the following Basic and Advanced tables:
Batters:
-
Basic: 9100 x 28 Features (2000 - 2021)
-
Advanced: 3200 x 321 Features (2014 - 2021)
Pitchers:
-
Basic: 9400 x 34 Features (2000 - 2021)
-
Advanced: 3900 x 334 Features (2014 - 2021)
Teams:
-
Basic: 1600 x 61 Features (1960 - 2021)
-
Advanced: 210 x 634 Features (2014 - 2021)
Basic data consists of traditional baseball statistics that have been collected for decades such as HRs, RBIs, and SOs. Advanced data consist of over 300 features collected by Statcast, a state-of-the-art tracking technology that allows for the collection and analysis of a massive amount of baseball data, in ways that were never possible in the past.
Since Statcast is a relatively new data collection technology, we have data isolated between 2014 - 2021.
The target variable identified for this analysis was player salary for individual batter and pitcher statistics, and wins for team statistics.
Feature Engineering and Handling
-
Missing Salaries: Batter and pitcher data was collected with the pybaseball package and split into basic and advanced stats. Player salaries were collected for each indidvidual year. There were many instances of missing salary values; these values were imputed based on prior salaries available for each player. For example, if Derek Jeter made $15M in 2010, and a missing value existed for 2011, the missing value would be filled with Jeter's previous year salary of $15M.
-
Missing Advanced Values: The advanced statcast data consisted of mostly sparse data for very specific data collection columns. For example, the wKN statistic measures how well a batter/pitcher performed against/using a knuckleball. Knuckleballs are rarely ever thrown in baseball and will therefore have many missing values. In this instance, these missing values would be filled with zeros.
-
Adjusting for Inflation: While the dataset was limited to players from the last 21 years, there is variance in the player salaries across the past two decades. To account for this, player salaries were adjusted for inflation using the national CPI index.
-
Average Salaries: The batter and pitcher datasets were grouped by each individual player's average salary across all the years that player played. This method effectively removed categorical features such as position and team played since many players played multiple positions and teams across their careers.
-
Salary Difference Between Years: To further account for variability in player contracts between years, the difference between player salaries each year was added as a feature into the batter and pitcher dataframes. This partially addresses the large salary difference for players who make a significant amount more entering free agency.
-
Feature Selection: To reduce complexity of the model, Sci-Kit Learn's
feature_selectionclass was implemented and found that theSelectKBestmethod performed the best when it came down to identifying the most important features and explaining the variance of the model. Domain knowledge about the game of baseball also came in handy here when selecting features and removing multicolinear features (ie. features that have correlational relationships with each other).
Preprocessing
-
A 75%-25% train-test split and 5-Fold validation was implemented for assessment on the batting, pitching, and team datasets.
-
A standard scaler was applied to each dataset to prepare for modeling. The target variable of Salary and Wins were log transformed and reverse logged once the data was passed through the modeling process.
To simplify the process of modeling, a helper function model_results was constructed to get individual model results consisting of training, testing, and validation scores. Metrics used for determining model performance are the coefficient of determination (R2), and the root mean square error (RMSE).
For further context, the RMSE can best be interpreted as the margin of error of a model's predictions. In other words, a RMSE of $3M means that the total difference of all errors between the model's predictions and actual values is about $3M.
Data Visualization
When holistically examining the batter and pitcher datasets, it is obvious that the superstars of MLB far outmake the vast majority of the average baseball player.
The salaries of these superstar players are also outliers and can be further explained by a multitude of factors not captured by the datasets. For example, below is a visualization of some of 2021's highest paid batters in MLB.

Overall, batters tend to make more on average than the pitcher. Understandably, batters ie. position players, play everyday and will likely be valued at a higher price than the pitcher who may not play every day.

The modeling process involved establishing a baseline linear regression model for each dataset and attempting to build a succesive model to improve upon the baseline. Models utilized in this analysis include support vector machine (SVM), gradient boost, random forest, CatBoost, XGBoost, and neural network (MLP Regressor).
In general, the training and testing datasets were passed through the preprocessing pipeline, and the training set was fit to each respective model. Hyperparameter tuning of each model was performed using GridSearchCV to find the optimum R2.
For a more detailed process of all the above data processing steps and modeling, please refer to the Modeling Notebooks in this repository.
The following visualizes the results for each dataset with the corresponding best performing model based on R2 and RMSE. Each plot demonstrates the model's ability to fit a linear regression line to the model's predicted vs. actual values. Residuals, or difference between actual and predicted values, are also plotted to show the difference of each point value.

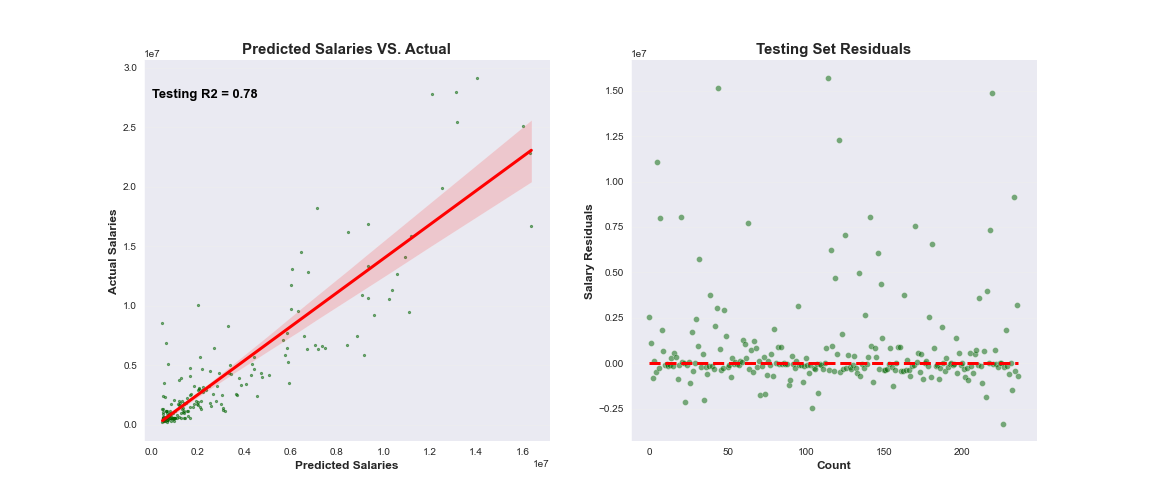
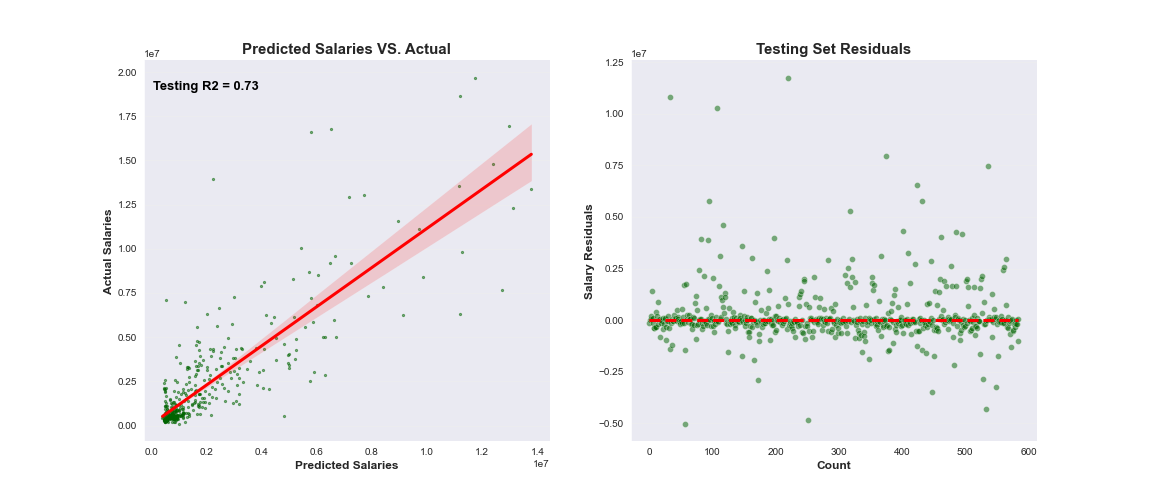
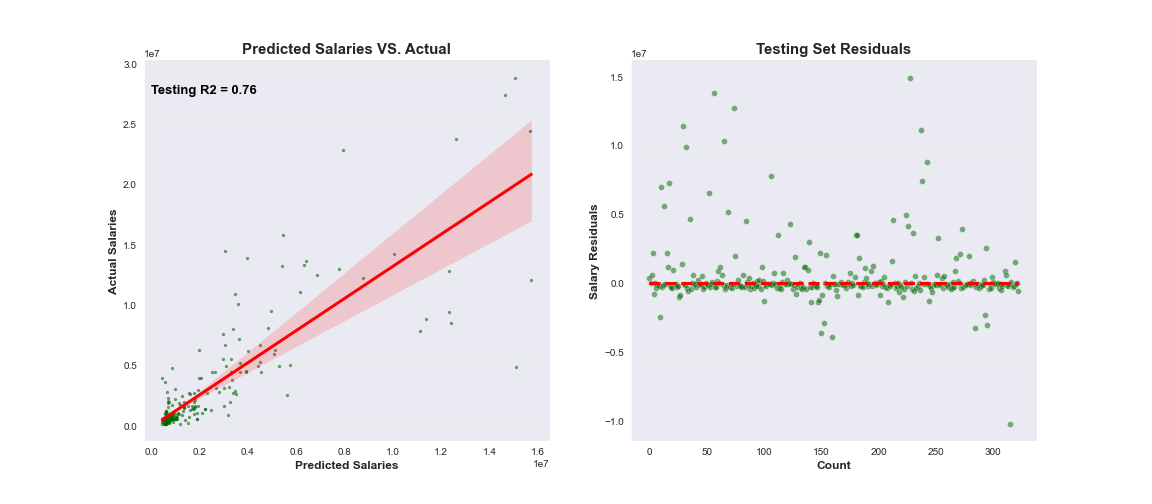

When comparing advanced metric tables to basic metric tables, there no significant difference in the R2 in explaining the variance of data. However, there is a larger relative RMSE likely due to less data points available between 2014 and 2021. As a reminder, basic metrics incorporate more data points between 2000 - 2021.
The best margin of error was less than $2M for batter and pitcher salaries for basic batter and pitcher data. Having manipulated the datasets and performed data analysis, possible explanations to explain for the variance in the data is as follows:
-
Superstar Outliers: The vast majority of major league players do not make nearly as much as the top 25% of players in baseball. This is illustrated by the average salary of pitchers and batters over the years. The spread between the salary of the average MLB batter and top players in baseball is so large that the model struggles to make accurate predictions for these outliers. This is further evidenced by the residual plots where the the model tends to under-estimate the actual value of a player's salary.
-
Age Heading Into Free Agency: Throughout the modeling, age was a consistent top contributing factor when determining player salaries. Those that are aware of sports contracts, it is typical to expect players to gradually make more money as they get older. Once a player becomes a free-agent (ie. players have the ability to sign with any team for any monetary amount), there are many other factors influencing player salaries that are not explained by baseball statistics alone. These factors could be marketability of the player, social media presence online, and general economic market demand for certain free agent players each year.
-
Multicollinearity: As discussed briefly, many of the features in each dataset are heavily collinear with each other. In order to reduce multicollinearity and complexity of the model, the most important features were selectively chosen at the risk of reducing R2 for a simpler model.
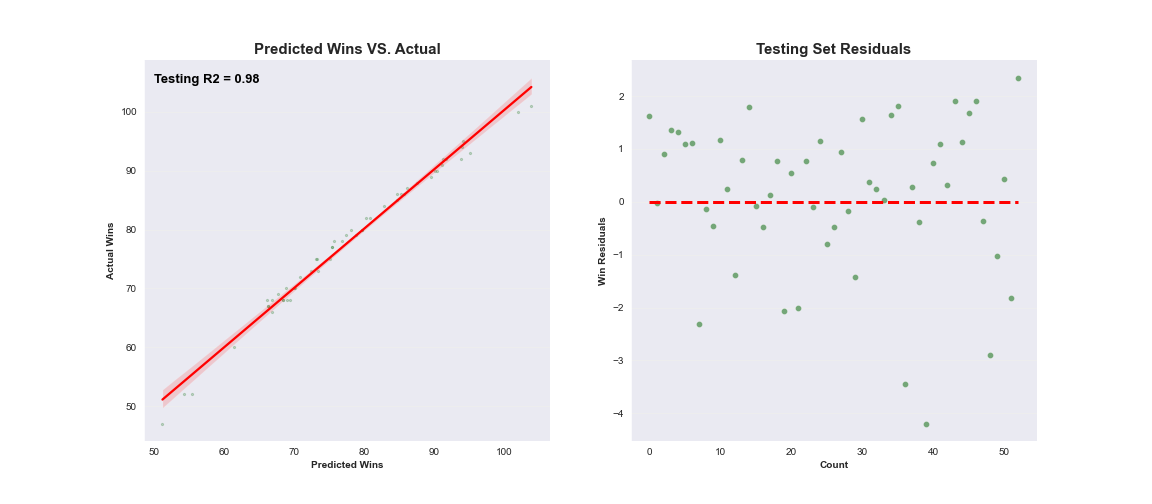
Not surprisingly, a simple multiple linear regression model performed especially well when determining team wins. This was expected as there are strong correlational relationships between simple team statistics. To win games, a team will need to score more runs than the other team. Conversely, the same team would need to give up less runs to the opponent in order to win. This is evidenced below as ER_p and H/9_p represent team pitching statistics related to a team's ability to limit opposing team runs.

It is also clear that timely pitching and hitting wins games as evidenced by the WPA advanced statistic. Win Probability Added (WPA) captures the change in Win Expectancy from one plate appearance to the next and credits or debits the player based on how much their action increased their team’s odds of winning.
Having performed analysis on advanced and basic data for batters, pitchers, and teams, there is no significant difference between using basic and advanced data to predict player salaries. However, there is a stronger relationship between advanced team data and wins suggesting that building a team around players that excel in advanced metrics can be beneficial.
- The batter and pitcher prediction models perform better on players who have not yet reached free agency and would likely garner a massive contract. The models struggle with predicting salaries of superstar outliers and older players who have already signed a large contract. The models are most effective in predicting salaries for players who are likely to go through their first years of arbitration or are playing early in their careers.
When it comes to winning games, the saying is that you could never have enough pitching. So it is no surprise that for our advanced model, simple pitching statistics such as earned runs allowed (ER) and opposing team hits per 9 innings (H/9) are strong features that explain the accuracy of the model. Correspondingly, the wFB feature stands out as a specific pitch type that outperforms all others.
- Fastballs are the most common pitch thrown in baseball. However, we are seeing more often pitchers throwing harder and faster and providing a competitive edge against opponents. Faster pitches tend to be more difficult to hit (ie. batter response time to hit a baseball). Target pitchers who excel at throwing fastballs above the average pitcher.
Timely hitting and pitching are other features that have a strong relationship with wins. For example, Shohei Ohtani and Corbin Burnes had the highest WPA (Win Probability Added) amongst all batters and pitchers in 2021.
- Building a team around players who excel at advanced metrics such as WPA and pitchers with above average fastballs are likely to produce a successful winning product.
In order to explain for the massive salary outliers, there are many other features to account for as discussed above:
-
For example, a player's agent can have a big impact on what type of salary he will command on the market.
-
Marketability of the player is another factor that would need to be accounted for. While a baseball player can prove his worth on the field, there are other immeasurable factors such as leadership and fan favorability that play a role as well.
-
Simple market demand for a player can greatly influence a player's contract due to supply and demand.
Explaining these outlier contracts can be further explored by gathering additional data for players having already reached free agency and analyzing the top 25% of player contracts.
├── Data Cleaning Notebooks
├── Data
├── Deployment
├── EDA.ipynb
├── Modeling Notebooks
└── images
└── .gitignore
└── README.md