Conversation
…#9678)

* Enable dictionary code changes

* Address review comments.

* Checkstyle violation

* Add e2e query execution test

* Review comments
* Customize stopword for Lucene Index

* Customize stopword for Lucene Index

* Customize stopword for Lucene Index

* Customize stopword for Lucene Index

* Customize stopword for Lucene Index
There was a problem hiding this comment.
Nit: suggest renaming the metric to something more descriptive like PARTITION_INGESTION_LAG_MS.
There was a problem hiding this comment.
I think we should also change milliseconds to something like partitionIngestionLagMs
.../src/main/java/org/apache/pinot/core/data/manager/realtime/LLRealtimeSegmentDataManager.java
Outdated
Show resolved
Hide resolved
 mcvsubbu
left a comment
mcvsubbu
left a comment
There was a problem hiding this comment.
- Consider emitting one metric for a table-host combination. That can be the maximum lag amongst all partitions for that table in the host. We have other metrics that indicate consumption rate on a per-partition basis, so that should help if we want to debug further.
- We should be emitting zero if we get back 0 events from the poll, right?
.../src/main/java/org/apache/pinot/core/data/manager/realtime/LLRealtimeSegmentDataManager.java
Outdated
Show resolved
Hide resolved
.../src/main/java/org/apache/pinot/core/data/manager/realtime/LLRealtimeSegmentDataManager.java
Outdated
Show resolved
Hide resolved
.../src/main/java/org/apache/pinot/core/data/manager/realtime/LLRealtimeSegmentDataManager.java
Outdated
Show resolved
Hide resolved
d68f32c to
7d58fd2
Compare
|
@mcvsubbu We considered a metric per table but that wont work because partitions are distributed across servers. Not sure what value will be added keeping a metric per host/per table, I have scheduled a discussing next Monday it would be nice to close on this then. Zero is being issues when we hit an empty batch on the most recent change. |
7d58fd2 to
ed1c4a3
Compare
ed1c4a3 to
1315db0
Compare
|
Hey @jugomezv Can you please rebase this PR with the latest. I am just confused with Stop words PR and your changes. It will be helpful for review |
 sajjad-moradi
left a comment
sajjad-moradi
left a comment
There was a problem hiding this comment.
Looks good overall.
One thing to consider:
I believe we need to come up with a strategy for the period in which the consuming segment is being completed. There's no consumption in that period. We have no idea what the lag is! Should we make the value of the new metric zero? Should we continue with the latest value? Or may be increase it linearly as the time passes? None of these cases represents the reality because we don't know even if there's a data available in the stream at that time!
.../src/main/java/org/apache/pinot/core/data/manager/realtime/LLRealtimeSegmentDataManager.java
Outdated
Show resolved
Hide resolved
| long lastMileIngestionDelayMs = System.currentTimeMillis() - msgMetadata.getRecordIngestionTimeMs(); | ||
| lastMileIngestionDelayMs = lastMileIngestionDelayMs < 0 ? 0 : lastMileIngestionDelayMs; | ||
| _serverMetrics.setValueOfPartitionGauge(_tableNameWithType, _partitionGroupId, | ||
| ServerGauge.PARTITION_INGESTION_LAG_MS, lastMileIngestionDelayMs); |
There was a problem hiding this comment.
lastMile and end2end (for _t header) are internal to our projects at Linkedin. From Pinot OSS's perspective, there's only one kafka topic and that's the one the RT servers consume from. Maybe drop lastMile or simply change it to the name of the metric partitionIngestionLagMs?
.../src/main/java/org/apache/pinot/core/data/manager/realtime/LLRealtimeSegmentDataManager.java
Outdated
Show resolved
Hide resolved
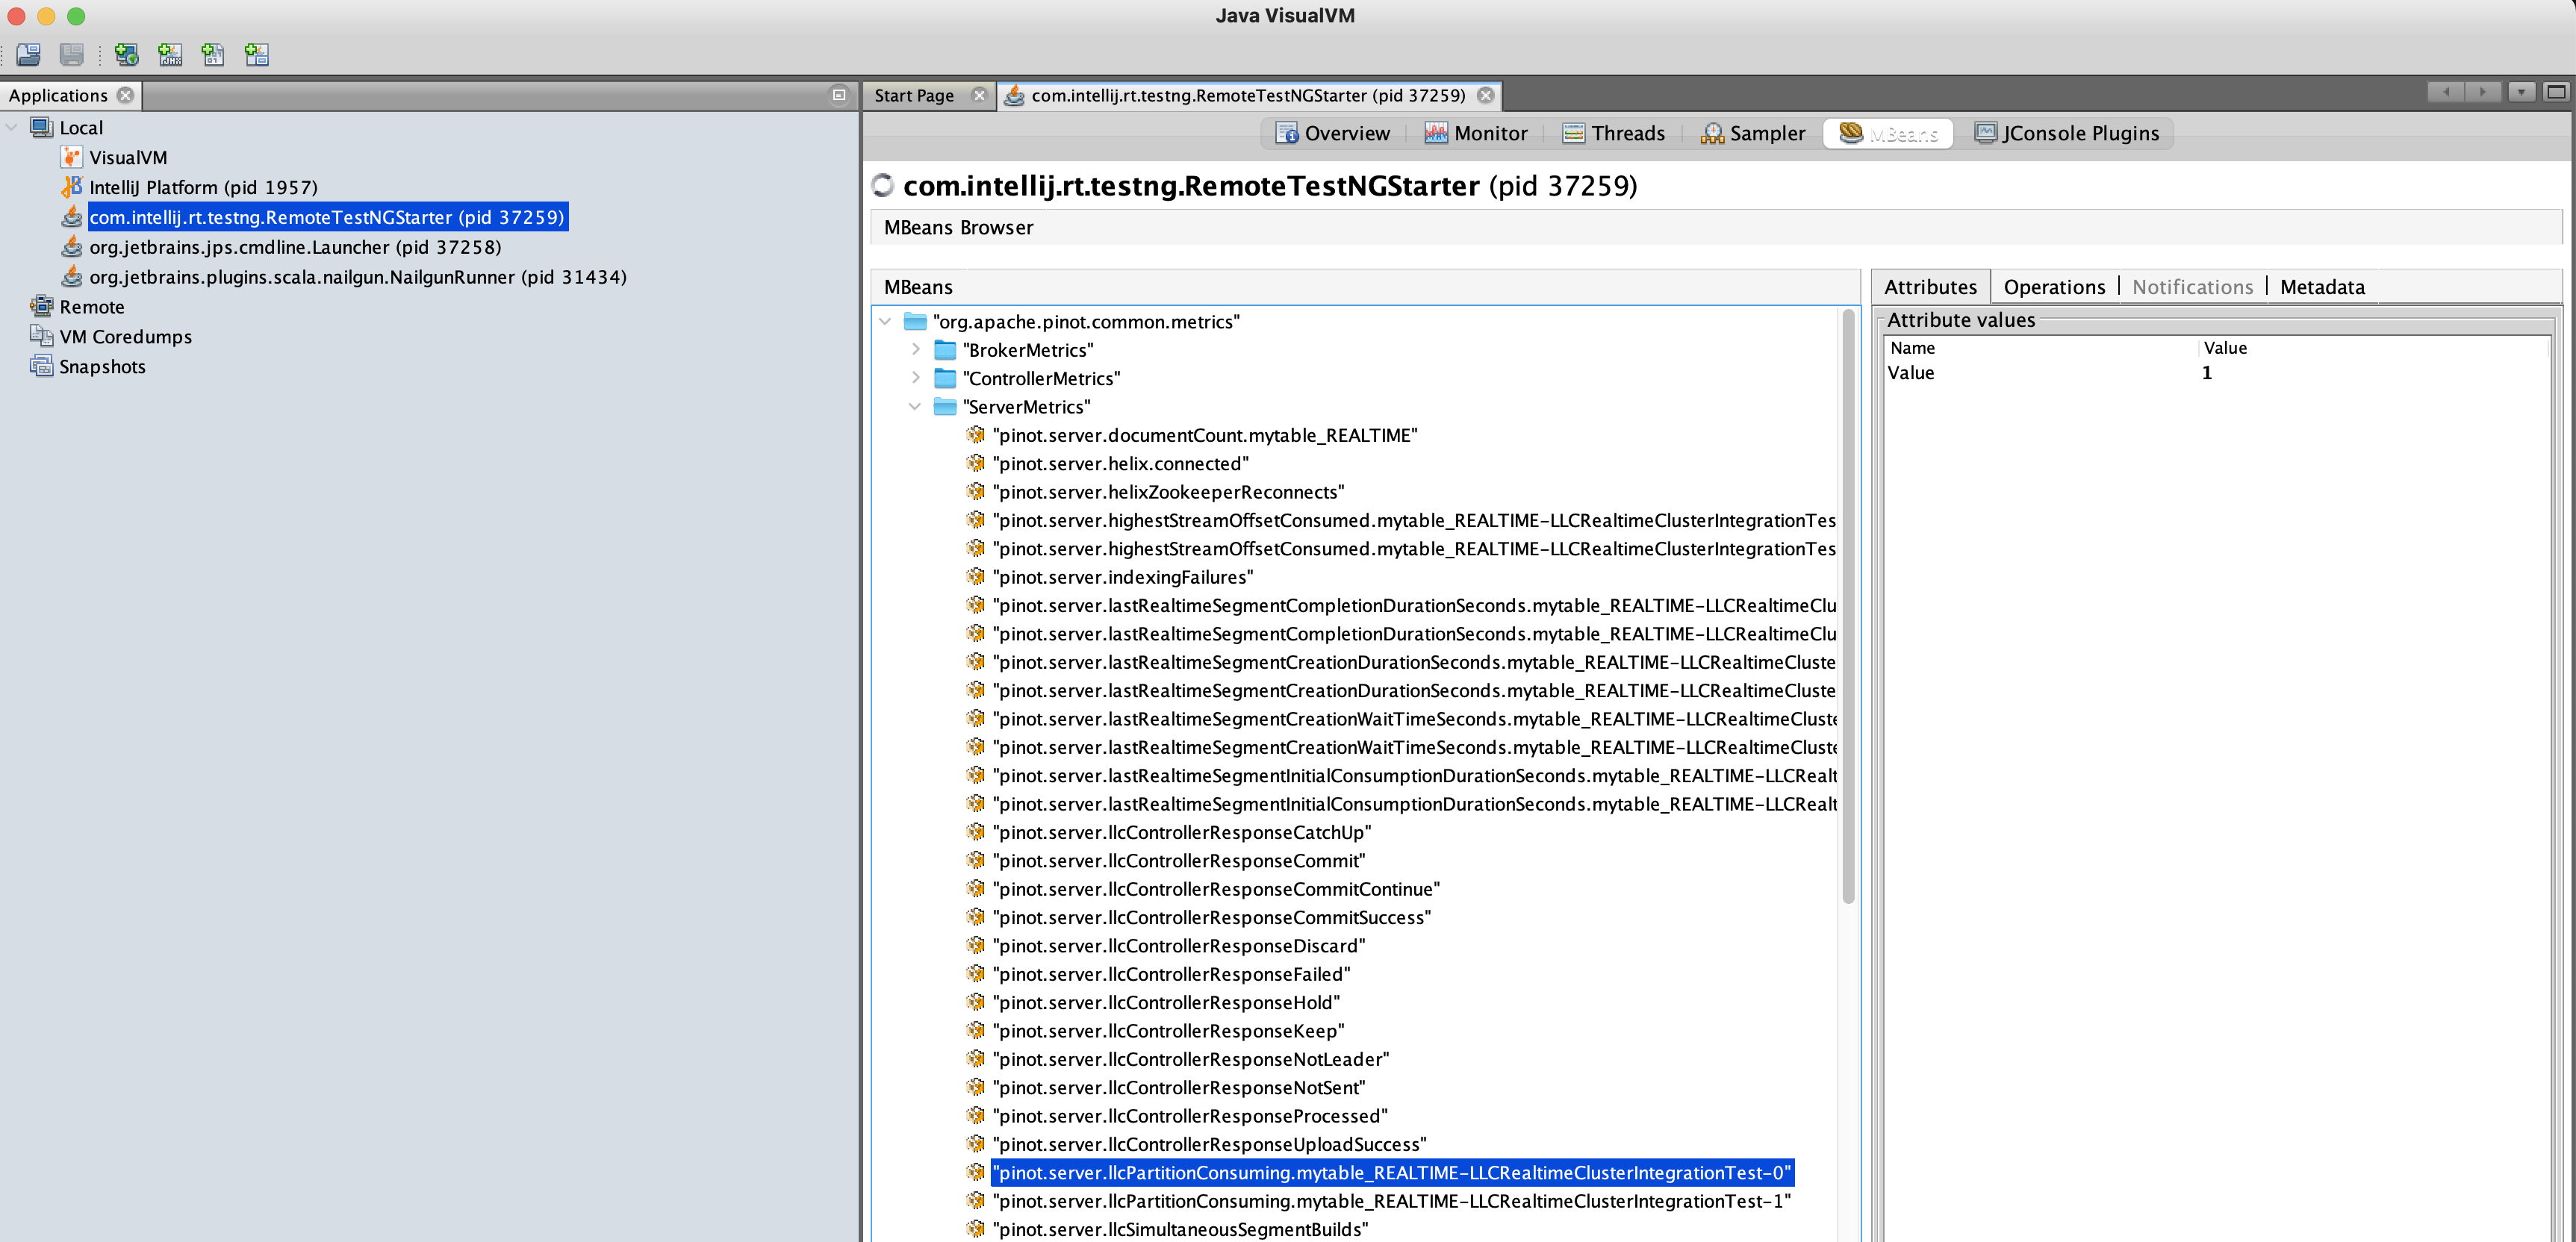
The metrics you highlighted in the screenshots are not the ones you added. |
Add a metrics that measures the time lag from when an event was posted to the last stage of the ingestion stream till the event was consumed by the realtime server.
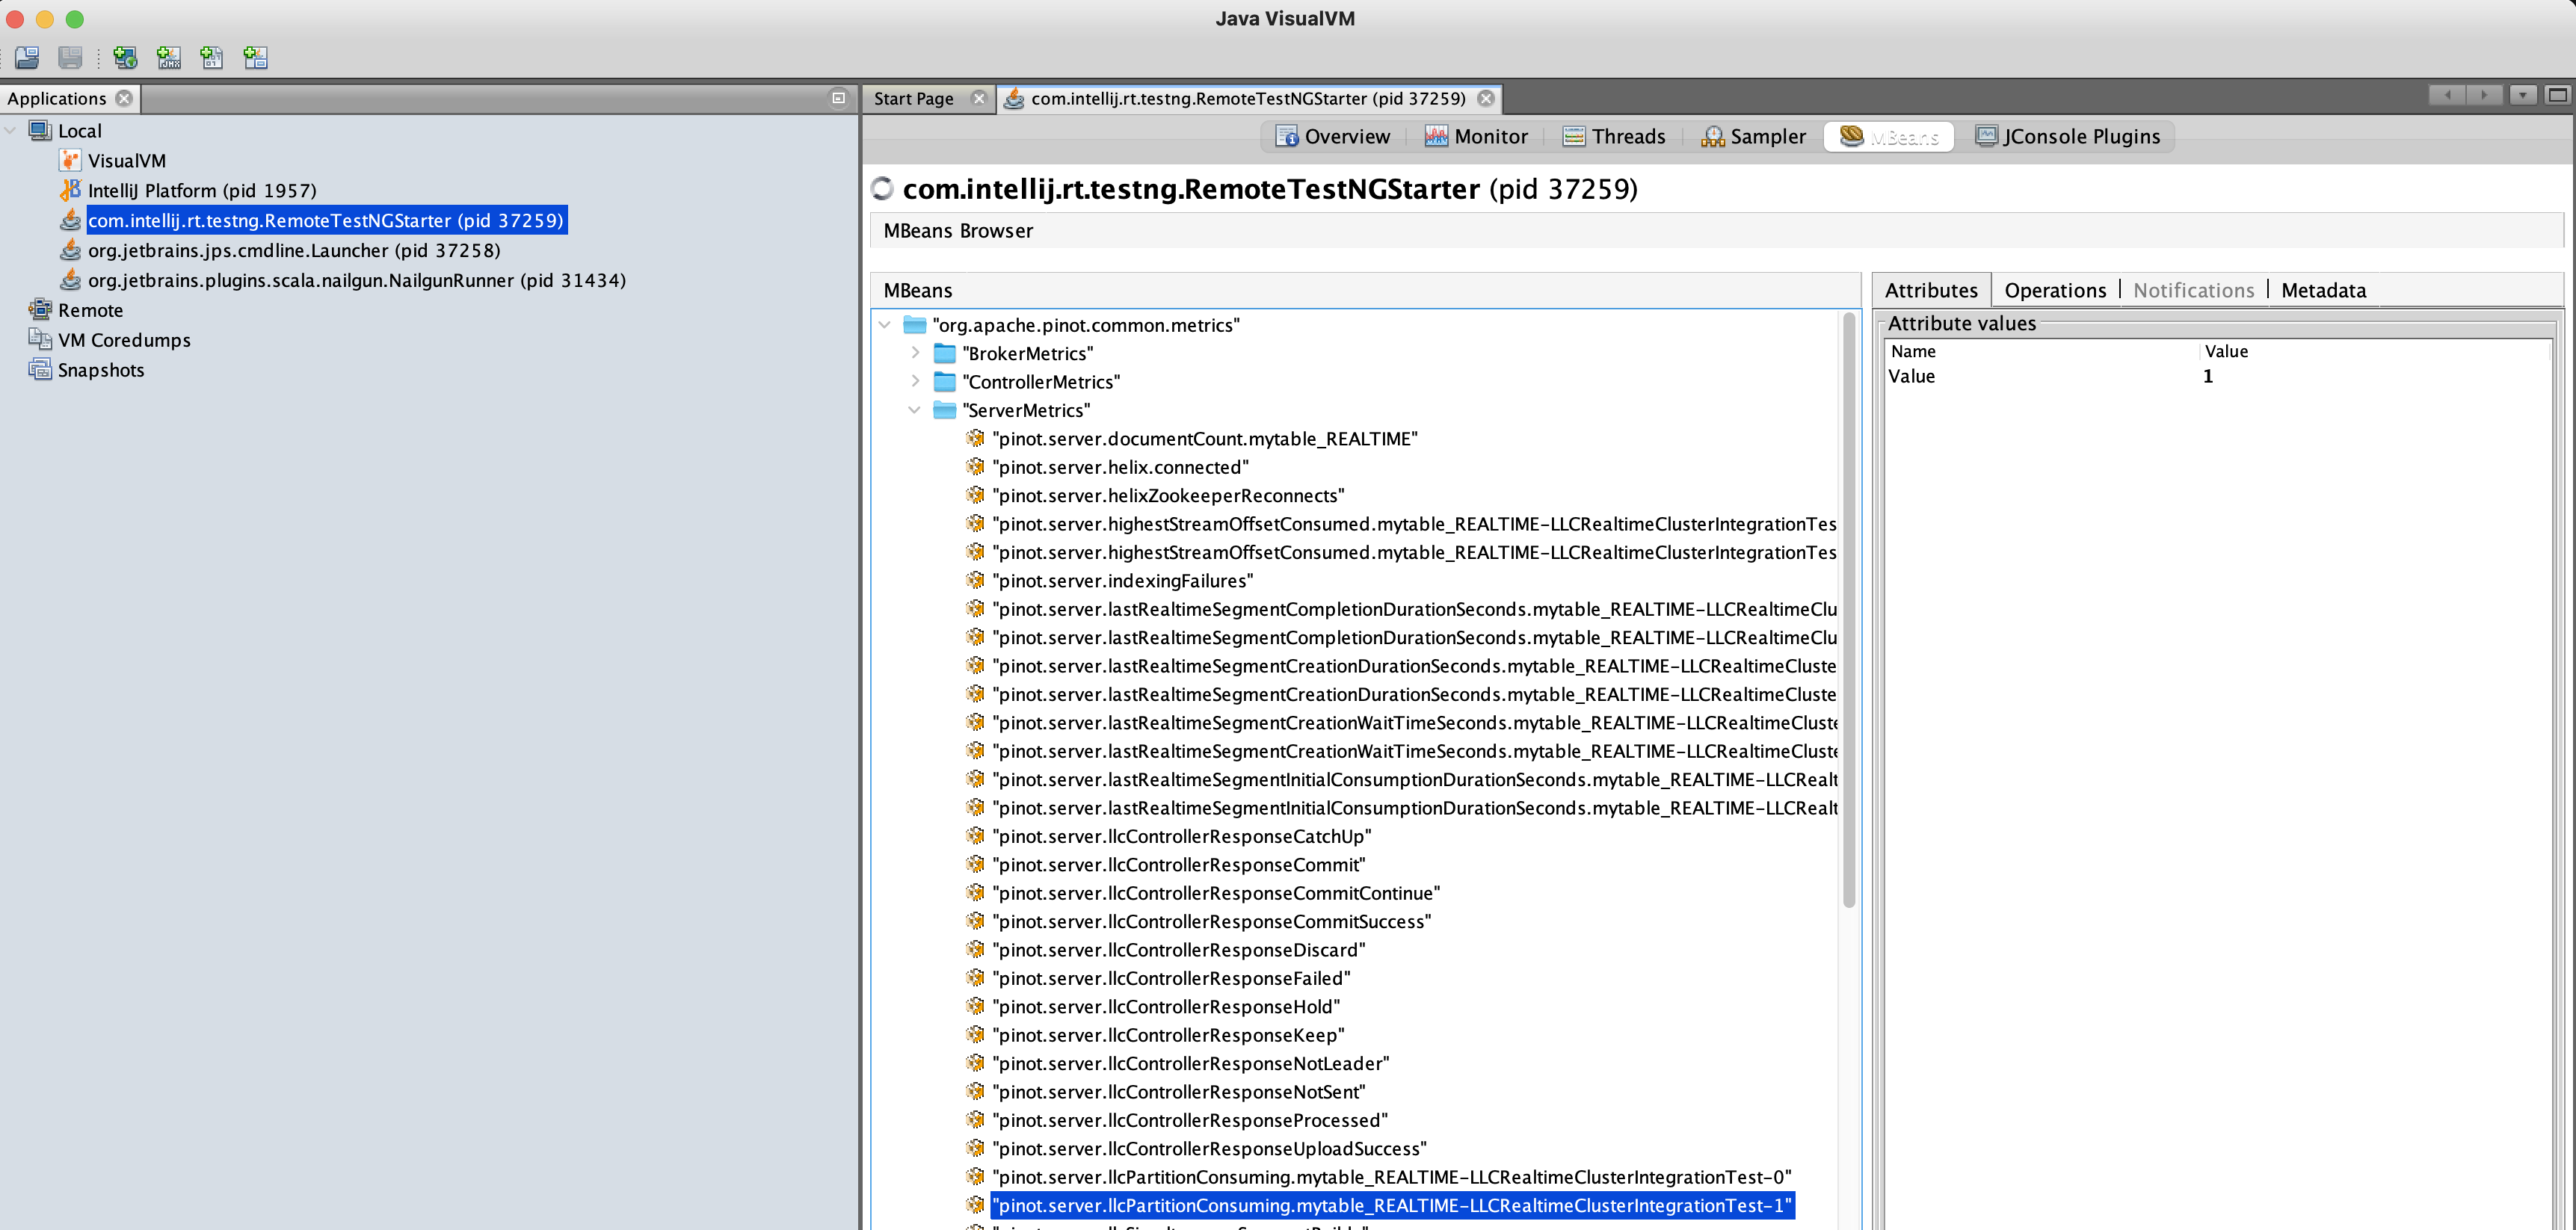
Tests performed: ran realtime LLC cluster integration test which includes table with two partitions and used jvisualvm to visualize metrics for both partitions after test completes. Enable warn log and monitored delta in time for each consumed row in realtime server, confirmed the last values logged are the last values contained in the metrics via jvisualvm. Confirmed we get a metric per-table, per partition.
Sample log traces of delay in milliseconds:
14:14:40.789 WARN [LLRealtimeSegmentDataManager_mytable__1__23__20221102T2114Z] [mytable__1__23__20221102T2114Z] ADDING REALTIME DATA FRESHNESS: delta=905[MS]
14:14:40.791 WARN [LLRealtimeSegmentDataManager_mytable__1__23__20221102T2114Z] [mytable__1__23__20221102T2114Z] ADDING REALTIME DATA FRESHNESS: delta=907[MS]