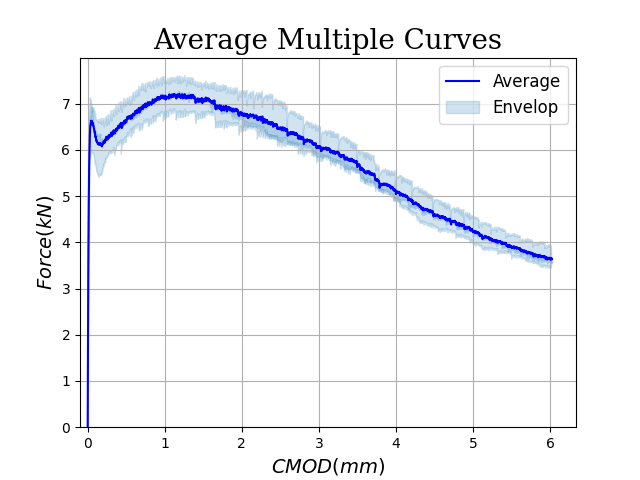
The Average Multiple Curves tool can average input curves, and output the result as XY Range.
- Put .CSV files in the python file directory.
- Edit the file names in input section : file_list=['file1','file2',....]
- and, set the x and y column names in the csv files.
- Other options are editable from the Input section.
- Run the python file :
python Average.py
The result will be saved on the output.csv located in the root directory and the graph will be shown on the screen.