MicroServices.js
MicroServices.js is a minimum implementation of a micro service architecture, based on Node.js and RabbitMQ. Every service is communicating throw the RabbitMQ broker.
Dependencies
- amqplib - Modern RabbitMQ client library. RabbitMQ is not included; you need to install it separately.
- Custom RabbitAdapter - Adapter that provides a rabbit.js-compatible API using amqplib
- cli-color - Used for colorized logging output
- msgpack5/bson - Used for efficient binary message serialization
- simply-uuid - Used for generating unique IDs
- prom-client - Prometheus client for metrics collection and monitoring
Architecture overview
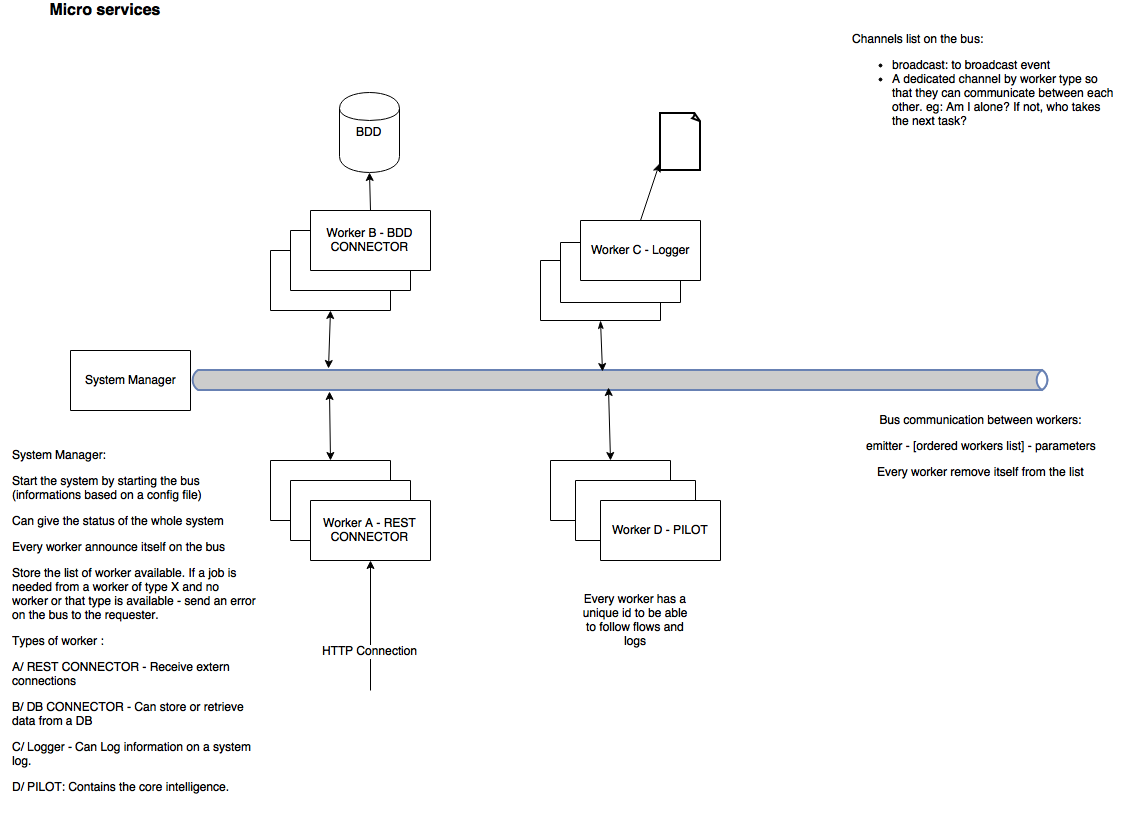
Components
- SystemManager - Central coordinator that tracks available workers
- RabbitMQ Bus - Message broker for communication between components
- Workers - Specialized service components that perform specific tasks
- Metrics - Monitoring system for collecting and exposing performance data
Global behavior
I advice to launch the bus and then the SystemManager, and after that the workers. Globally speaking, workers are communicating with each other via the bus and specific messages. The first thing they do is to declare themselves to the SystemManager and the other workers of the same type. Then, they share messages via the bus. The principal messages is to ask for another worker to do a job. In my example, the REST worker receive the external message, send it to the Pilot worker who will know what to do with it. He can ask for the DB worker to store an information and the say ok to the client via the REST worker.
Roles
- SystemManager's aim is to controls what happens on the bus. He stores the list of workers available. He can answer to a worker asking for a job by sending an error if there's no worker of the good type available. He can provide the list of the workers on the bus.
- Worker's aim is to perform a dedicated work. DB worker can connect to a DB, REST worker can answer REST requests. You can extend worker to do whatever you want.
Communications
Workers present them selves on the network by send a message on the channel "notifications", on the topic "worker.new". It allows the SystemManager and the other worker to discover it.
By now, this message looks like this:
{"id":"WB:1460306476102","type":"WB"}
id is the ID of the worker. Currently, it is composed of the type of the worker and the timestamp of creation of the worker.
When a worker shut down, it send a message on the bus to delete the worker from the list. It is the same message, except that it is sent on the topic: worker.del.
As, the SystemManager can be launch after the workers, it can get the list of all workers, by sending a message on the worker.getAll topic. The workers, send the same message than when they arrive on the network.
System configuration
The only configuration mandatory is the RabbitMQ connection URL. It is stored in the config/config.json file. You can add a keepalive key that allow the SystemManager to regularly ask for Workers list. If 0 or no entry, the keepalive is not done. For performance purpose, you can activate binary exchanges on the bus. See data_transfer_protocol.
/**
* Config file for every worker
* contains the information to connect to the broker
* broker_url: url of the broker system. Here RabbitMQ
* keepalive: frequency of keepalive made by SystemManager
* SystemManager_log: activate SystemManager logging
* Worker_log: activate Worker logging
* data_transfer_protocol: data compression type on the bus.
*         Supported: JSON/BSON/MessagePack
*
**/
{
"broker_url": "amqp://localhost",
"keepalive": 1000,
"SystemManager_log": true,
    "Worker_log": true,
    "data_transfer_protocol": "msgpack"
}
Ack and retry
When a job is sent, the worker that take it have to send an ack. If no worker does, the job is resend every 2s until it is taken or the SystemManager says that there's no worker of the good type. If an ack is receive by the sender for a job he sent, he remove it from the list of pending jobs.
Create your own system
To create your own system you have to inherit a dedicated com from the Worker class Here an example of a DB Worker
// Child class of Worker dedicated to DB connection
var Worker = require("./Worker.js");
var logger = require("./logger.js");

var DBW = new Worker("WB");
DBW.treatError = function(error) {
        logger. log("MicroService", "Worker B - DB connector", "Error received");
}

DBW.storeInDB = function(data) {
        // DO Whatever
}

DBW.getFromDB = function() {
        // DO Whatever
}
logger.js is a logger function to log on the console with colored syntax
MicroServices.js includes a built-in metrics system for monitoring your microservices architecture in real-time. The metrics module is based on Prometheus, a popular open-source monitoring solution.
Key features:
- Automatic collection of system metrics (CPU, memory, etc.)
- Custom application metrics for message passing and processing
- Worker-specific metrics
- Job processing time measurements
- Error tracking
- Prometheus-compatible HTTP endpoint
- Designed for integration with Grafana dashboards
The metrics system exposes the following metrics:
Counter Metrics:
microservices_messages_received_total- Total number of messages received by service (labeled by service and type)microservices_messages_sent_total- Total number of messages sent by service (labeled by service and type)microservices_job_errors_total- Total number of job processing errors (labeled by service and error_type)
Gauge Metrics:
microservices_workers_total- Number of workers by typemicroservices_connected_workers- Number of workers connected to the bus
Histogram Metrics:
microservices_job_processing_seconds- Time spent processing jobs (labeled by service and job_type)
Metrics are automatically collected in both SystemManager and Worker components. The metrics are exposed on a Prometheus-compatible HTTP endpoint (default port 9091).
Custom metrics can be added to your applications by using the metrics API:
// Record a received message
metrics.recordMessageReceived('message_type');

// Record a sent message
metrics.recordMessageSent('message_type');

// Time a job execution
const timer = metrics.startJobTimer('job_type');
// ... perform job ...
timer(); // Stop the timer

// Record worker counts
metrics.setWorkerCount('worker_type', count);

// Record errors
metrics.recordError('error_type');To use the metrics with Prometheus and Grafana:
- Configure Prometheus to scrape the metrics endpoint
- Set up Grafana to query Prometheus
- Import the provided dashboards
Sample Prometheus configuration in monitoring/prometheus.yml:
scrape_configs:
  - job_name: 'microservices'
    scrape_interval: 15s
    static_configs:
- targets: ['localhost:9091']The metrics dashboard provides:
- Worker health and connectivity
- Message throughput by service and type
- Job processing times and latency distribution
- Error rates and types
- System resource utilization
TODO
- Add enhanced logging options and log rotation
- Expand metrics collection for additional service types
- Add more detailed Grafana dashboards
This section covers how to deploy the MicroServices application in a production environment on AWS.
- AWS account with appropriate IAM permissions
- AWS CLI installed and configured
- Docker and Docker Compose installed locally
- Basic knowledge of AWS services (EC2, ECS, VPC, etc.)
There are several approaches to deploying the MicroServices project on AWS:
The simplest approach is to launch EC2 instances and run the application using Docker Compose.
-
Launch an EC2 instance
- Use Amazon Linux 2 or Ubuntu Server (recommended: t3.medium or larger)
- Ensure security groups allow necessary ports (5672, 15672 for RabbitMQ; 8080 for REST worker; 9090, 9091, 3000 for monitoring)
-
Install Docker and Docker Compose
# For Amazon Linux 2
sudo yum update -y
sudo amazon-linux-extras install docker -y
sudo service docker start
sudo usermod -a -G docker ec2-user
sudo curl -L "https://github.com/docker/compose/releases/latest/download/docker-compose-$(uname -s)-$(uname -m)" -o /usr/local/bin/docker-compose
sudo chmod +x /usr/local/bin/docker-compose

# For Ubuntu
sudo apt update
sudo apt install -y docker.io docker-compose
sudo usermod -a -G docker ubuntu
-
Clone the repository and deploy
git clone https://github.com/kobe1980/MicroServices.git
cd MicroServices

# Update config/config.json to use RabbitMQ container hostname
# e.g., "broker_url": "amqp://admin:adminpassword@rabbitmq:5672"

# Start the services
docker-compose up -d
-
Configure CloudWatch for logs (optional)
# Install CloudWatch agent
sudo yum install -y amazon-cloudwatch-agent

# Configure Docker logs to forward to CloudWatch
sudo vi /etc/docker/daemon.json
# Add the following:
{
  "log-driver": "awslogs",
  "log-opts": {
    "awslogs-region": "your-aws-region",
    "awslogs-group": "microservices"
  }
}

# Restart Docker
sudo service docker restart
For production workloads, AWS ECS provides better scaling and management capabilities.
-
Create ECR Repositories
- Create a repository for each microservice
aws ecr create-repository --repository-name microservices/system-manager
aws ecr create-repository --repository-name microservices/rest-worker
aws ecr create-repository --repository-name microservices/pilot-worker
aws ecr create-repository --repository-name microservices/db-worker
-
Build and push Docker images
# Login to ECR
aws ecr get-login-password --region your-region | docker login --username AWS --password-stdin your-account-id.dkr.ecr.your-region.amazonaws.com

# Build and tag images (example for SystemManager)
docker build -t your-account-id.dkr.ecr.your-region.amazonaws.com/microservices/system-manager:latest .

# Push images
docker push your-account-id.dkr.ecr.your-region.amazonaws.com/microservices/system-manager:latest
-
Create ECS Cluster
- Use the AWS Console or CLI to create an ECS cluster
- Choose between EC2 or Fargate launch types based on your requirements
-
Create Task Definitions
- Create separate task definitions for each component:
- RabbitMQ
- SystemManager
- Each Worker type
- Prometheus and Grafana (optional)
- Create separate task definitions for each component:
-
Configure Service Discovery
- Use AWS Cloud Map or service discovery in ECS to enable components to find each other
-
Deploy Services
- Create ECS services for each component
- Configure appropriate scaling policies
For more complex deployments with Kubernetes:
-
Create an EKS cluster
eksctl create cluster --name microservices-cluster --region your-region --node-type t3.medium --nodes 3
-
Convert docker-compose.yml to Kubernetes manifests
- Use tools like Kompose or manually create Kubernetes YAML files
- Create deployments, services, and configmaps
-
Deploy to EKS
kubectl apply -f kubernetes/
-
Networking
- VPC with public and private subnets
- Security groups for each component
- Load balancer for REST Worker (ALB recommended)
-
Compute
- EC2 instances or ECS/EKS for container orchestration
- Auto-scaling groups for scalability
-
Data Storage
- EBS volumes for RabbitMQ persistence
- S3 for log archival
-
Monitoring
- CloudWatch for logs and metrics
- Amazon Managed Grafana (optional)
- CloudWatch alarms for critical metrics
For production deployments, ensure high availability by:
-
RabbitMQ Cluster
- Deploy a 3-node RabbitMQ cluster across availability zones
- Use RabbitMQ's mirrored queues or quorum queues for message replication
-
Redundant Workers
- Deploy multiple instances of each worker type
- Enable auto-scaling based on load
-
Multi-AZ Deployment
- Distribute components across multiple availability zones
-
Network Security
- Place RabbitMQ in private subnets
- Use security groups to restrict access
- Enable TLS for RabbitMQ connections
-
Authentication
- Use AWS Secrets Manager for RabbitMQ credentials
- Configure strong passwords for all components
-
Data Protection
- Encrypt data at rest (EBS volumes)
- Encrypt data in transit (TLS for RabbitMQ)
-
Use CloudWatch for logs and metrics
- Forward Docker logs to CloudWatch
- Create custom metrics from Prometheus
-
Set up alarms for critical events
- Worker disconnect events
- High message queue depth
- Error rate thresholds
-
Create dashboard for system overview
- Combine CloudWatch and Grafana metrics
- Use spot instances for workers (when possible)
- Configure auto-scaling to match demand
- Use appropriate instance sizes based on workload
Example
In the example, you can find a REST Worker, accepting connexion on port 8080. If http method is not post or get, or if path is different from /movies/, it will responde 404. Else, it will send a message to the Pilot Worker to treat the customer request. The Pilot will ask the DB Worker to store or retrieve the data and send it back to the REST Worker. Finally, the REST Worker responde the client. If an error occurs, the REST Worker will answer with HTTP 500 code.
Tests
Tests are built with Mocha, Should, Sinon, and nyc (formerly Istanbul) for test coverage. Current test coverage is excellent:
- Overall coverage: 98.2%
- RabbitAdapter: 98.41%
- Compressor: 96.42%
- Logger: 100%
- Metrics: 100%
Specific test suites:
- Unit tests for all core modules
- Comprehensive tests for error handling
- Tests for all serialization formats (JSON, BSON, MessagePack)
- Mocked RabbitMQ connection for reliable testing
- Integration tests for metrics collection
- Worker and SystemManager metrics instrumentation tests
The Compressor module has comprehensive test coverage (96.42%) with tests for:
-
Different serialization formats:
- JSON (default format)
- BSON (Binary JSON for complex data)
- MessagePack (efficient binary serialization)
-
Testing strategies:
- Direct method testing for all serialization/deserialization functions
- Protocol switching via configuration
- Edge case handling for various data types
- Buffer and non-Buffer input handling
- Unicode and special character support
-
Mock testing:
- Protocol implementations mocked for complete branch coverage
- Serializer/deserializer function mocking with Sinon
Run the tests with:
# Run all tests
npm test

# Run only metrics tests
npm run test:metrics

# Run tests with coverage
npm run coverage

# Run only metrics tests with coverage
npm run coverage:metrics
Tested with the 3 workers in example directory and a bus on AWS EC2 micro instances. Response time < 90ms.
Release notes:
-
0.0.10: Enhanced test coverage and documentation
- Improved Compressor.js test coverage to over 96%
- Added comprehensive tests for all serialization formats
- Added AWS deployment documentation for production environments
- Extended documentation for test coverage details
-
0.0.9: Added monitoring capabilities and improved worker instrumentation
- Added Prometheus metrics collection and monitoring
- Implemented metrics tracking in SystemManager and Worker classes
- Added metrics test suite with 100% coverage
- Created Grafana dashboards for visualization
- Documented metrics collection API and usage
-
0.0.8: Modernized libraries and improved test coverage
- Replaced legacy rabbit.js with modern amqplib
- Added custom RabbitAdapter for seamless backward compatibility
- Updated all dependencies to latest secure versions
- Added comprehensive test suite with nearly 100% coverage
- Fixed potential security vulnerabilities
-
0.0.7: Added support for multiple serialization formats
- JSON (default) - Standard text-based serialization
- BSON - Binary serialization for complex data types
- MessagePack - Efficient binary serialization
-
0.0.5: Update Worker id, so that you can now either send a job to any worker of the good type, or to a specific worker.
- To send a job to any worker, send to Worker_type:*
- To send a job to a specific worker send to worker id
Here is a sample of code:
// "Stuff to do" will be sent to any worker of type WD
Worker.sendToNextWorker(["WD:*"], {data: "Stuff to do"});
// "Stuff to do" will be sent to worker of type WD with id WA:1461679731775
Worker.sendToNextWorker(["WD:1461679731775"], {data: "Stuff to do"});
The custom RabbitAdapter provides a compatibility layer between the modern amqplib library and the original rabbit.js API. This ensures that existing code continues to work without modifications while benefiting from the updated security and performance of the newer library.
Key features:
- Same interface as rabbit.js for drop-in compatibility
- Uses modern Promise-based asynchronous code
- Improved error handling and logging
- Comprehensive test coverage
Written with StackEdit.