Spoiler: Working with tabular data (csv) in the command line is difficult.
ph makes it easy:
$ pip install ph
$ cat iris.csv | ph columns
150
4
setosa
versicolor
virginica
$ cat iris.csv | ph columns setosa versicolor | ph head 15 | ph tail 5 | ph show
      setosa    versicolor
--  --------  ------------
 0       1.5           0.2
 1       1.6           0.2
 2       1.4           0.1
 3       1.1           0.1
 4       1.2           0.2
$ cat iris.csv | ph describe
150 4 setosa versicolor virginica
count 150.000000 150.000000 150.000000 150.000000 150.000000
mean 5.843333 3.057333 3.758000 1.199333 1.000000
std 0.828066 0.435866 1.765298 0.762238 0.819232
min 4.300000 2.000000 1.000000 0.100000 0.000000
25% 5.100000 2.800000 1.600000 0.300000 0.000000
50% 5.800000 3.000000 4.350000 1.300000 1.000000
75% 6.400000 3.300000 5.100000 1.800000 2.000000
max 7.900000 4.400000 6.900000 2.500000 2.000000Occasionally you would like to plot a CSV file real quick, in which case you can
simply pipe it to ph plot:
Suppose you have a dataset covid.csv
SK,Italy,Iran,France,Spain,US
51,79,95,57,84,85
104,150,139,100,125,111
204,227,245,130,169,176
433,320,388,191,228,252
602,445,593,212,282,352
833,650,978,285,365,495
977,888,1501,423,430,640
1261,1128,2336,613,674,926
1766,1694,2922,949,1231,NaN
2337,2036,3513,1126,1696,NaN
3150,2502,4747,1412,NaN,NaN
4212,3089,5823,1748,NaN,NaN
4812,3858,6566,NaN,NaN,NaN
5328,4638,7161,NaN,NaN,NaN
5766,5883,8042,NaN,NaN,NaN
6284,7375,NaN,NaN,NaN,NaN
6767,9172,NaN,NaN,NaN,NaN
7134,10149,NaN,NaN,NaN,NaN
7382,NaN,NaN,NaN,NaN,NaN
7513,NaN,NaN,NaN,NaN,NaN
With this simple command, you get a certified "So fancy" plot.
$ cat covid.csv | ph plot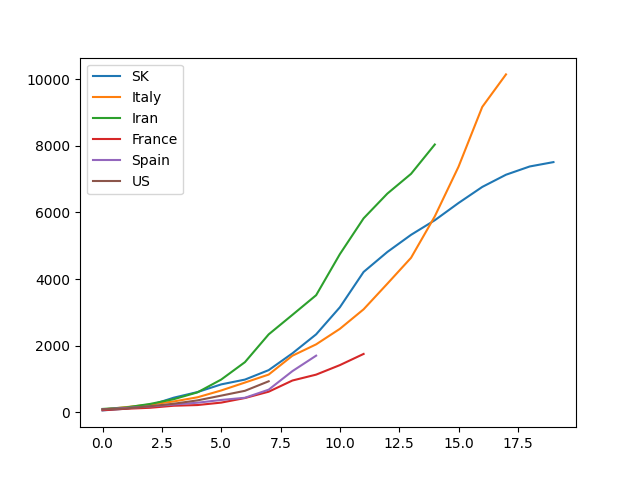
(Notice that this needs matplotlib: pip install ph[plot])
Using the pipeline in Linux is nothing short of a dream in the life of the computer super user.
However the pipe is clearly most suited for a stream of lines of textual data, and not when the stream is actually tabular data.
Tabular data is much more complex to work with due to its dual indexing and the fact that we often read horizontally and often read vertically.
The defacto format for tabular data is csv
(comma-separated values,
which is not perfect in any sense
of the word), and the defacto tool for working with tabular data in Python is
Pandas.
This is a shell utility ph (pronounced phi)
that reads tabular data from
standard in
and allows
you to perform a pandas function on the data, before writing it to standard out
in csv format.
The goal is to create a tool which makes it nicer to work with tabular data in a pipeline.
To achieve the goal, ph then reads csv data, does some manipulation,
and prints out csv data. With csv as the invariant, ph can be used in
a pipeline.
A very quick introduction to what ph can do for you,
run this in your shell:
ph open csv https://raw.githubusercontent.com/owid/covid-19-data/master/public/data/archived/ecdc/total_cases.csv \
    | ph slugify                                                       \
    | ph columns date norway sweden denmark                            \
    | ph diff norway sweden denmark                                    \
    | ph spencer norway sweden denmark                                 \
    | ph rolling 7 norway sweden denmark --how=mean                    \
    | ph dropna                                                        \
    | ph slice 50:                                                     \
    | ph plot --linewidth=3 --savefig=cases.svg --index=date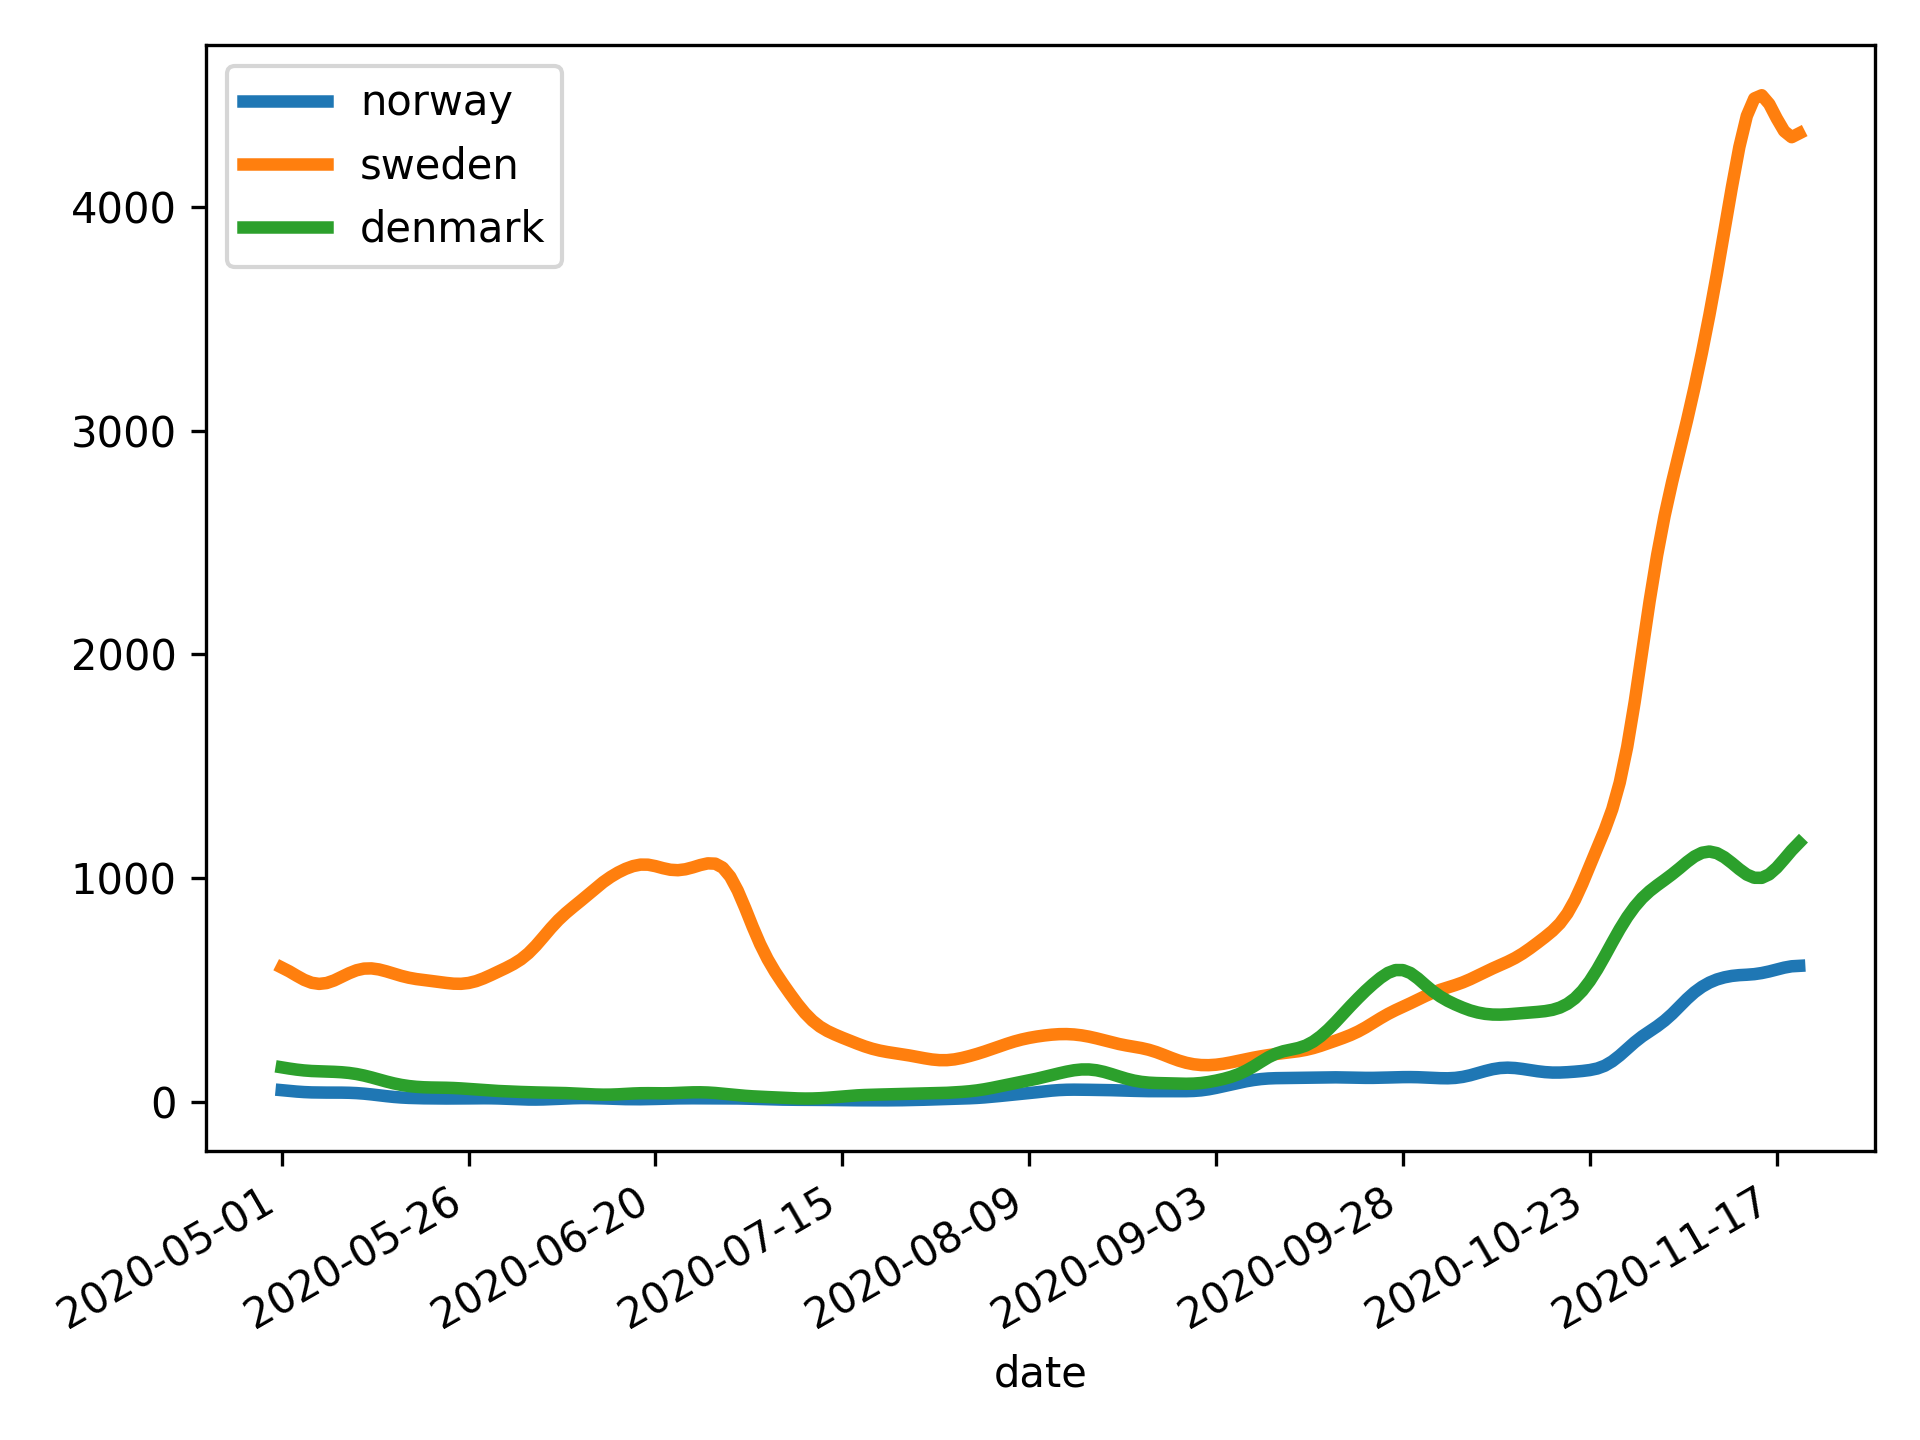
- Getting started
- Example usage
- The tools
- Working with different formats
If you have installed ph[data], you can experiment using ph dataset if you
don't have an appropriate csv file available.
ph dataset boston | ph describeAvailable datasets are from scikit-learn.datasets
Toy datasets:
bostonirisdiabetesdigitslinnerudwinebreast_cancer
Real world:
olivetti_faceslfw_peoplelfw_pairsrcv1kddcup99california_housing
Suppose you have a csv file a.csv that looks like this:
x,y
3,8
4,9
5,10
6,11
7,12
8,13
Transpose:
$ cat a.csv | ph transpose
0,1,2,3,4,5
3,4,5,6,7,8
8,9,10,11,12,13
median (as well as many others, e.g. abs, corr, count, cov, cummax,
cumsum, diff, max, product, quantile, rank, round, sum, std,
var etc.):
$ cat a.csv | ph median
x,y
5.5,10.5
Use ph help to list all commands
cat
It is possible to concatenate (cat) multiple csv-files with ph cat:
$ ph cat a.csv b.csv --axis=index$ ph cat a.csv b.csv --axis=columnsThe functionality is described in
pandas.concat.
open
You can open a csv, json, excel, gpx (etc., see supported
formats) using ph open type file:
$ ph open excel a.xlsx$ ph open excel a.xlsx --sheet_name=0 --skiprows=3$ ph open tsv a.tsv$ ph open csv a.csvIn the event that the csv data starts on the first line (i.e. no
header is present), use --header=None:
$ ph open csv a.csv --header=Nonefrom
The ph from command works similarly to ph open but reads from stdin
instead of opening a file. It therefore does not take a filename
argument:
$ cat /etc/passwd | ph from csv --sep=':' --header=NoneConsider again the covid.csv file from above.
$ cat covid.csv | ph dropnawill remove all rows that contain N/A (nan) values. If we want to keep all
rows with at least 5 non-N/A values, we can use
$ cat covid.csv | ph dropna --thresh=5If we want to drop all columns with N/A values instead of all rows, we use
--axis=1.
If we want to drop only columns (resp. rows) with all n/a values, we use
--how=all.
To replace N/A values with other values, we can simply run
cat covid.csv | ph fillna 999.75If we instead want to pad the N/A values, we use --method=pad
cat covid.csv | ph fillna --method=padWe can limit the number of consecutive N/A values that are filled by using
(e.g.) --limit=7.
Using head and tail works approximately as the normal shell equivalents,
however they will preserve the header if there is one, e.g.
$ cat a.csv | ph head 7 | ph tail 3
x,y
6,11
7,12
8,13If the csv file contains a column, e.g. named x containing
timestamps, it can be parsed as such with ph date x:
$ cat a.csv | ph date x
x,y
1970-01-04,8
1970-01-05,9
1970-01-06,10
1970-01-07,11
1970-01-08,12
1970-01-09,13
If your column is formatted with freedom units, mm/dd/yyyy, you can
use the flag --dayfirst=True:
dateRep,geoId
01/04/2020,US
31/03/2020,US
30/03/2020,US
29/03/2020,US
28/03/2020,US
$ cat ~/cov.csv | ph date dateRep --dayfirst=True
dateRep,geoId
2020-04-01,US
2020-03-31,US
2020-03-30,US
2020-03-29,US
2020-03-28,US
To get a column with integers (e.g. 3-8) parsed as, e.g. 2003 - 2008, some
amount of hacking is necessary. We will go into details later on the eval and
appendstr.
$ cat a.csv | ph eval "x = 2000 + x" | ph appendstr x - | ph date x
x,y
2003-01-01,8
2004-01-01,9
2005-01-01,10
2006-01-01,11
2007-01-01,12
2008-01-01,13
However, it is possible to provide a --format instruction to date:
$ cat a.csv | ph eval "x = 2000 + x"  | ph date x --format="%Y"
x,y
2003-01-01,8
2004-01-01,9
2005-01-01,10
2006-01-01,11
2007-01-01,12
2008-01-01,13
Under some very special circumstances, we may have a unix timestamp in
a column, in which the --utc=True handle becomes useful:
Consider utc.csv:
date,x,y
1580601600,3,8
1580688000,4,9
1580774400,5,10
1580860800,6,11
1580947200,7,12
1581033600,8,13
where you get the correct dates:
$ cat utc.csv | ph date date --utc=True
date,x,y
2020-02-02,3,8
2020-02-03,4,9
2020-02-04,5,10
2020-02-05,6,11
2020-02-06,7,12
2020-02-07,8,13Merging two csv files is made available through ph merge f1 f2.
Consider left.csv
key1,key2,A,B
K0,K0,A0,B0
K0,K1,A1,B1
K1,K0,A2,B2
K2,K1,A3,B3
and right.csv
key1,key2,C,D
K0,K0,C0,D0
K1,K0,C1,D1
K1,K0,C2,D2
K2,K0,C3,D3
We can merge them using (default to --how=inner)
$ ph merge left.csv right.csv
key1,key2,A,B,C,D
K0,K0,A0,B0,C0,D0
K1,K0,A2,B2,C1,D1
K1,K0,A2,B2,C2,D2
or using an outer join:
$ ph merge left.csv right.csv --how=outer
key1,key2,A,B,C,D
K0,K0,A0,B0,C0,D0
K0,K1,A1,B1,,
K1,K0,A2,B2,C1,D1
K1,K0,A2,B2,C2,D2
K2,K1,A3,B3,,
K2,K0,,,C3,D3
and we can specify on which column to join:
$ ph merge left.csv right.csv --on=key1 --how=outer
key1,key2_x,A,B,key2_y,C,D
K0,K0,A0,B0,K0,C0,D0
K0,K1,A1,B1,K0,C0,D0
K1,K0,A2,B2,K0,C1,D1
K1,K0,A2,B2,K0,C2,D2
K2,K1,A3,B3,K0,C3,D3
In the case when the two files do not share a common column key, we can join them on key1 from the left file and key2 from the right file by specifying
$ ph merge mergel.csv merger.csv --left=key1 --right=key2Consider c.csv:
it,fr,de
79,57,79
157,100,130
229,130,165
323,191,203
470,212,262
655,285,545
889,423,670
1128,653,800
1701,949,1040
2036,1209,1224
2502,1412,1565
3089,1784,1966
3858,2281,2745
4636,2876,3675
5883,3661,4181
Print the column names:
$ cat c.csv | ph columns
it
fr
de
Selecting only certain columns, e.g. de and it
$ cat c.csv | ph columns de it | ph tail 3
de,it
2745,3858
3675,4636
4181,5883$ cat c.csv | ph rename de Germany | ph rename it Italy | ph columns Italy Germany
Italy,Germany
79,79
157,130
229,165
323,203
470,262
655,545
889,670
1128,800
1701,1040
2036,1224
2502,1565
3089,1966
3858,2745
4636,3675
5883,4181In addition to rename there is an auxiliary function slugify that
lets you slugify the column names. Consider slugit.csv
  Stupid column 1,  Jerky-column No. 2
3,8
4,9
5,10
6,11
7,12
8,13
$ cat slugit.csv | ph slugify
stupid_column_1,jerky_column_no_2
3,8
4,9
5,10
6,11
7,12
8,13
Then you can do
$ cat slugit.csv | ph slugify | ph rename stupid_column_1 first | ph rename jerky_column_no_2 second
first,second
3,8
4,9
5,10
6,11
7,12
8,13We can replace values in the data (or in a single column) using ph replace. The syntax is
ph replace old new [--column=x [--newcolumn=xp]]:
$ cat a.csv| ph replace 8 100
x,y
3,100
4,9
5,10
6,11
7,12
100,13
$ cat a.csv| ph replace 8 100 --column=x
x,y
3,8
4,9
5,10
6,11
7,12
100,13$ cat a.csv| ph replace 8 100 --column=x --newcolumn=xp
x,y,xp
3,8,3
4,9,4
5,10,5
6,11,6
7,12,7
8,13,100Slicing in Python is essential, and occasionally, we want to slice
tabular data, e.g. look at only the 100 first, or 100 last rows, or
perhaps we want to look at only every 10th row. All of this is achieved
using ph slice start:end:step with standard Python slice syntax.
$ cat a.csv | ph slice 1:9:2
x,y
4,9
6,11
8,13
Reversing:
$ cat a.csv|ph slice ::-1
x,y
8,13
7,12
6,11
5,10
4,9
3,8
See also ph head and ph tail.
$ cat a.csv | ph slice :3
x,y
3,8
4,9
5,10
equivalent to
$ cat a.csv | ph head 3
x,y
3,8
4,9
5,10You can sum columns and place the result in a new column using
eval (from
pandas.DataFrame.eval).
$ cat c.csv | ph eval "total = it + fr + de" | ph tail 3
it,fr,de,total
3858,2281,2745,8884
4636,2876,3675,11187
5883,3661,4181,13725
$ cat a.csv | ph eval "z = x**2 + y"
x,y,z
3,8,17
4,9,25
5,10,35
6,11,47
7,12,61
8,13,77If you only want the result, you leave the eval expression without assignment
$ cat a.csv | ph eval "x**2"
x
9
16
25
36
49
64You can normalize a column using ph normalize col.
$ cat a.csv | ph eval "z = x * y" | ph normalize z
x,y,z
3,8,0.0
4,9,0.15
5,10,0.325
6,11,0.525
7,12,0.75
8,13,1.0We can query data using ph query expr.
$ cat a.csv | ph query "x > 5"
x,y
6,11
7,12
8,13
$ ph open csv 'http://bit.ly/2cLzoxH' | ph query "country == 'Norway'" | ph tabulate --headers
country year pop continent lifeExp gdpPercap
-- --------- ------ ----------- ----------- --------- -----------
0 Norway 1952 3.32773e+06 Europe 72.67 10095.4
1 Norway 1957 3.49194e+06 Europe 73.44 11654
2 Norway 1962 3.63892e+06 Europe 73.47 13450.4
3 Norway 1967 3.78602e+06 Europe 74.08 16361.9
4 Norway 1972 3.933e+06 Europe 74.34 18965.1
5 Norway 1977 4.04320e+06 Europe 75.37 23311.3
6 Norway 1982 4.11479e+06 Europe 75.97 26298.6
7 Norway 1987 4.18615e+06 Europe 75.89 31541
8 Norway 1992 4.28636e+06 Europe 77.32 33965.7
9 Norway 1997 4.40567e+06 Europe 78.32 41283.2
10 Norway 2002 4.53559e+06 Europe 79.05 44684
11 Norway 2007 4.62793e+06 Europe 80.196 49357.2The powerful grep is one of the most used command line tools, and it
would be silly to not ship a version of it ourselves. Using ph grep
is rarely necessary, but helps when you want to ensure the header is
kept.
$ cat txtfile.csv | ph grep "a|b" --case=False --column=Text_Column --regex=FalseThe arguments denote
--caseshould be case sensitive?--columngrep only in given column--regexuse regex for pattern?
Occasionally csv files come with additional spaces which can lead to
difficulties in parsing the cells' contents. A csv file should be
formatted without spaces after the comma 42,17 over 42, 17. But
since we are human, we sometimes make mistakes.
If we want to strip, or trim, the contents of a column, we use ph strip:
$ cat txtfile.csv | ph strip col1 col2If strip is not sufficiently powerful, it is possible to
removeprefix or removesuffix using
$cat txtfile.csv | ph removeprefix col1 patternand similarly for removesuffix.
The normal Pandas describe is of course available:
$ cat a.csv | ph describe
              x          y
count  6.000000   6.000000
mean   5.500000  10.500000
std    1.870829   1.870829
min    3.000000   8.000000
25%    4.250000   9.250000
50%    5.500000  10.500000
75%    6.750000  11.750000
max 8.000000 13.000000The shorthand ph show simply calls the below ph tabulate --headers.
$ cat a.csv | ph show
      x    y
--  ---  ---
 0    3    8
 1    4    9
 2    5   10
 3    6   11
 4    7   12
5 8 13The amazing tabulate tool comes from the Python package tabulate on PyPI.
The tabulate command takes arguments --headers to toggle printing of header
row, --format=[grid,...] to modify the table style and --noindex to remove
the running index (leftmost column in the example above).
Among the supported format styles are
plain,simple,grid,fancy_grid,pretty,github,rst,mediawiki,html,latex,- ... (See full list at the project homepage at python-tabulate.)
You can the columns in the csv data by a certain column:
$ cat iris.csv  | ph sort setosa | ph tail 5
150,4,setosa,versicolor,virginica
7.9,3.8,6.4,2.0,2
7.6,3.0,6.6,2.1,2
7.7,3.8,6.7,2.2,2
7.7,2.8,6.7,2.0,2
7.7,2.6,6.9,2.3,2You can plot data using ph plot [--index=col].
$ ph open parquet 1A_2019.parquet | ph columns Time Value | ph plot --index=TimeThis will take the columns Time and Value from the timeseries provided by
the given parquet file and plot the Value series using Time as index.
The following example plots the life expectancy in Norway using year as index:
$ ph open csv http://bit.ly/2cLzoxH | ph query "country == 'Norway'" | ph appendstr year -01-01 | ph columns year lifeExp | ph plot --index=year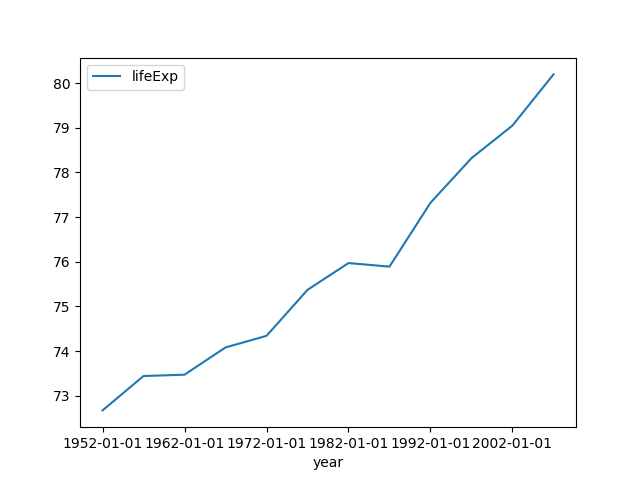
Note: The strange
ph appendstr year -01-01turns the items1956into"1956-01-01"and2005into"2005-01-01". These are necessary to make pandas to interpret1956as a year and not as a millisecond.The command
ph appendstr col str [newcol]takes a string and appends it to a column, overwriting the original column, or writing it tonewcolif provided.
Advanced plotting
You can choose the kind of plotting ( ‘line’, ‘bar’, ‘barh’, ‘hist’, ‘box’,
‘kde’, ‘density’, ‘area’, ‘pie’, ‘scatter’, ‘hexbin’), the style of plotting
(e.g. --style=o), and in case of scatter plot, you need to specify --x=col1
and --y=col2, e.g.:
$ ph open csv http://bit.ly/2cLzoxH | ph query "continent == 'Europe'" | ph plot --kind=scatter --x=lifeExp --y=gdpPercap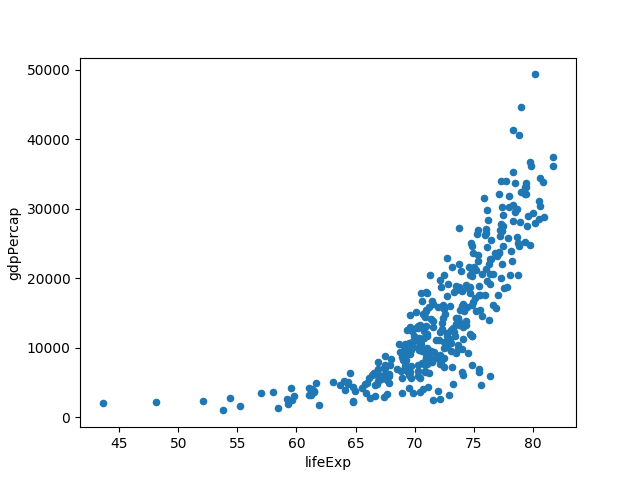
To specify the styling k-- gives a black dashed line:
$ ph open csv http://bit.ly/2cLzoxH | ph query "country == 'Norway'" | ph appendstr year -01-01 | ph columns year lifeExp | ph plot --index=year --style=k--Using plot headless
Occasionally we would like to generate a plot to an image(-like) file on the command line or in a script, without necessarily launching any graphic user interface.
Calling ph plot with the argument --savefig=myfile.png will create a
PNG file called myfile.png instead of opening the matplotlib window.
It is also possible to get other formats by using different extensions,
like eps, pdf, pgf, png, ps, raw, rgba, svg, svgz.
iplot with plotly and cufflinks
Instead of using the matplotlib backend, there is an option for using plotly
and cufflinks to generate
interactive plots.
This depends on cufflinks, and can be installed with pip install ph[iplot].
$ cat a.csv | ph iplot --kind=bar --barmode=stack$ cat a.csv | ph iplot --kind=scatter --mode=markersSuppose you have a csv file
Animal,Max Speed
Falcon,380.0
Falcon,370.0
Parrot,24.0
Parrot,26.0
You can use Pandas' groupby functionality to get the aggregated sum,
mean, or first value:
$ cat group.csv | ph groupby Animal --how=mean
Max Speed
375.0
25.0
If you want to retain the index column,
$ cat group.csv | ph groupby Animal --how=mean --as_index=False
Animal,Max Speed
Falcon,375.0
Parrot,25.0
rolling
Compute rolling averages/sums using ph rolling 3 --how=mean
Consider again a.csv:
x,y
3,8
4,9
5,10
6,11
7,12
8,13
Moving average with window size 3:
$ cat a.csv|ph rolling 3 --how=mean | ph dropna
x,y
4.0,9.0
5.0,10.0
6.0,11.0
7.0,12.0
Rolling sum with window size 2:
$ cat a.csv|ph rolling 2 --how=sum | ph dropna
x,y
7.0,17.0
9.0,19.0
11.0,21.0
13.0,23.0
15.0,25.0
ewm — exponentially weighted methods
$ cat a.csv | ph ewm --com=0.5 --how=mean | ph show
          x         y
--  -------  --------
 0  3         8
 1  3.75      8.75
 2  4.61538   9.61538
 3  5.55     10.55
 4  6.52066  11.5207
 5  7.50824  12.5082
Use either com (center of mass), span, halflife, or alpha,
together with --how=mean, --how=std, --how=var, etc.
expanding — expanding window
A common alternative to rolling statistics is to use an expanding window, which yields the value of the statistic with all the data available up to that point in time.
$ cat a.csv | ph expanding 3
x,y
,
,
12.0,27.0
18.0,38.0
25.0,50.0
33.0,63.0
Spencer's 15-weight average
We also support an experimental and slow version of Spencer's 15-weight average. This method takes a window of size 15, and pointwise multiply with the following vector (normalized)
(-3, -6, -5, 3, 21, 46, 67, 74, 67, 46, 21, 3, -5, -6, -3)
and then takes the sum of the resulting vector.
Spencer's 15-weight average is an interesting (impulse response) filter that preserves all up to cubic polynomial functions.
Occasionally you need to have an index, in which case ph index is your tool:
$ cat a.csv | ph index
index,x,y
0,3,8
1,4,9
2,5,10
3,6,11
4,7,12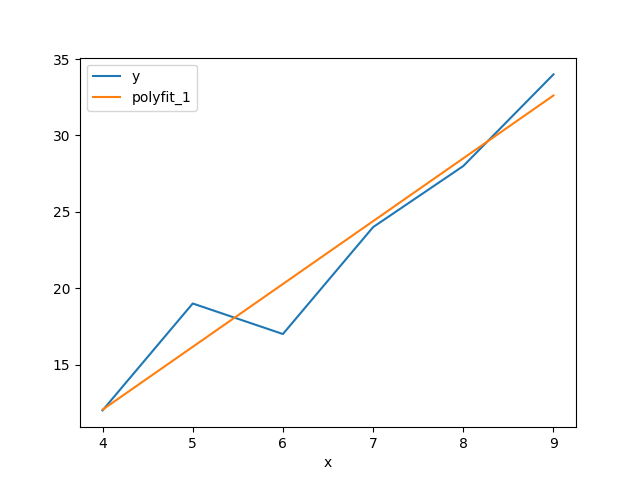
5,8,13You can perform linear regression and polynomial regression on a certain
index column x and a y = f(x) column using ph polyfit. It takes two
arguments, the x column name, the y column name and an optional
--deg=<degree>, the degree of the polynomial. The default option is --deg=1
which corresponds to a linear regression.
Suppose you have a csv file lr.csv with content
x,y
4,12
5,19
6,17
7,24
8,28
9,34
With linear (polynomial) regression, you get an extra column, polyfit_{deg}:
$ cat lr.csv | ph polyfit x y | ph astype int
x,y,polyfit_1
4,12,12
5,19,16
6,17,20
7,24,24
8,28,28
9,34,32
Using ph plot --index=x results in this plot:
Pandas supports reading a multitude of readers.
To read an Excel file and pipe the stream, you can use ph open.
The syntax of ph open is ph open ftype fname, where fname is the
file you want to stream and ftype is the type of the file.
A list of all available formats is given below.
$ ph open xls a.xlsx
x,y
3,8
4,9
5,10
6,11
7,12
8,13
You can open a semicolon separated values file using --sep=";"
$ ph open csv --sep=";" fname.csvObserve the following:
{"x":{"0":3,"1":4,"2":5,"3":6,"4":7,"5":8},
 "y":{"0":8,"1":9,"2":10,"3":11,"4":12,"5":13}}
Of course, then,
$ cat a.csv | ph to json | ph from json
x,y
3,8
4,9
5,10
6,11
7,12
8,13
This also means that
$ cat a.csv | ph to json > a.json
$ cat a.json
{"x":{"0":3,"1":4,"2":5,"3":6,"4":7,"5":8},
 "y":{"0":8,"1":9,"2":10,"3":11,"4":12,"5":13}}
$ cat a.json | ph from json
x,y
3,8
4,9
5,10
6,11
7,12
8,13
You can open Excel-like formats using ph open excel fname.xls[x], parquet
files with ph open parquet data.parquet. Note that these two examples require
xlrd and pyarrow, respectively, or simply
pip install ph[complete]
csv/tsv(the latter for tab-separated values)fwf(fixed-width file format)jsonhtmlclipboard(pastes tab-separated content from clipboard)xlsodfhdf5featherparquetorcstatasasspsspicklesqlgbq/google/bigquery
We also support reading GPX files with ph open gpx.
This uses the GPX Python library gpxpy.