This repository generates figures that illustrate the memory-wall problem in modern GPUs and accelerators. It produces both graphics (e.g. PDF/PNG) and the corresponding TikZ/PGFPlots code, making the figures easy to reuse in papers, slides, and LaTeX documents. The figures are derived from the CSV dataset located here.
All figures are automatically built in CI. The latest generated outputs are available on the gh-pages branch.
The idea for these visualizations is inspired by the first figure of a very nice paper called AI and the Memory Wall by Gholami et al. The authors also provide a repository. However, the raw data underlying the first figure is not publicly available.
The goal of this project is therefore to reconstruct the figure in a transparent and reproducible way, based on openly collected and documented data.
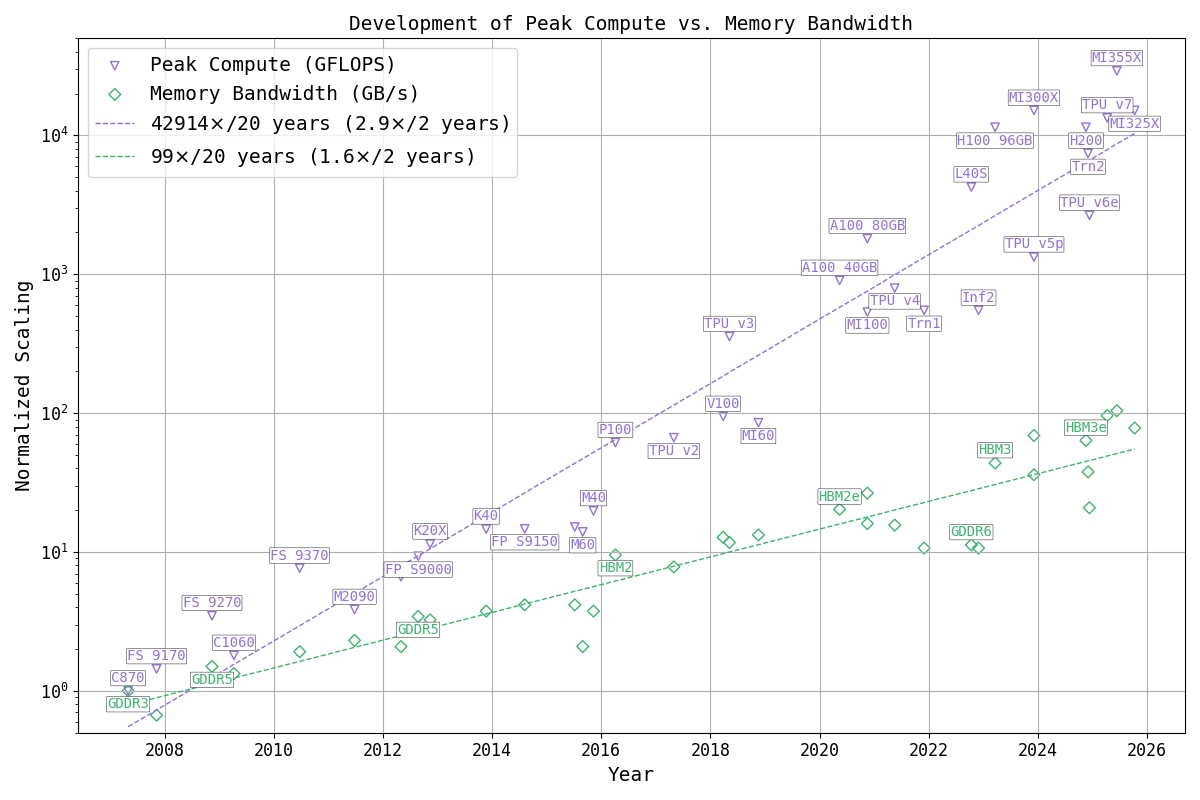
The first figure shows the historical evolution of peak compute throughput versus memory bandwidth for GPUs and accelerators, always using the fastest supported floating-point datatype (not integer) of each architecture.
- Until the mid-2010s, this was typically FP32
- Later generations introduced FP16, bfloat16, FP8, MXFP4, etc.
- In the 2020s, additional gains come from structured sparsity
The exact datatype used for each chip is documented in data/datacenter_chips.csv under the column dtype.
This analysis concentrates on floating-point data types.
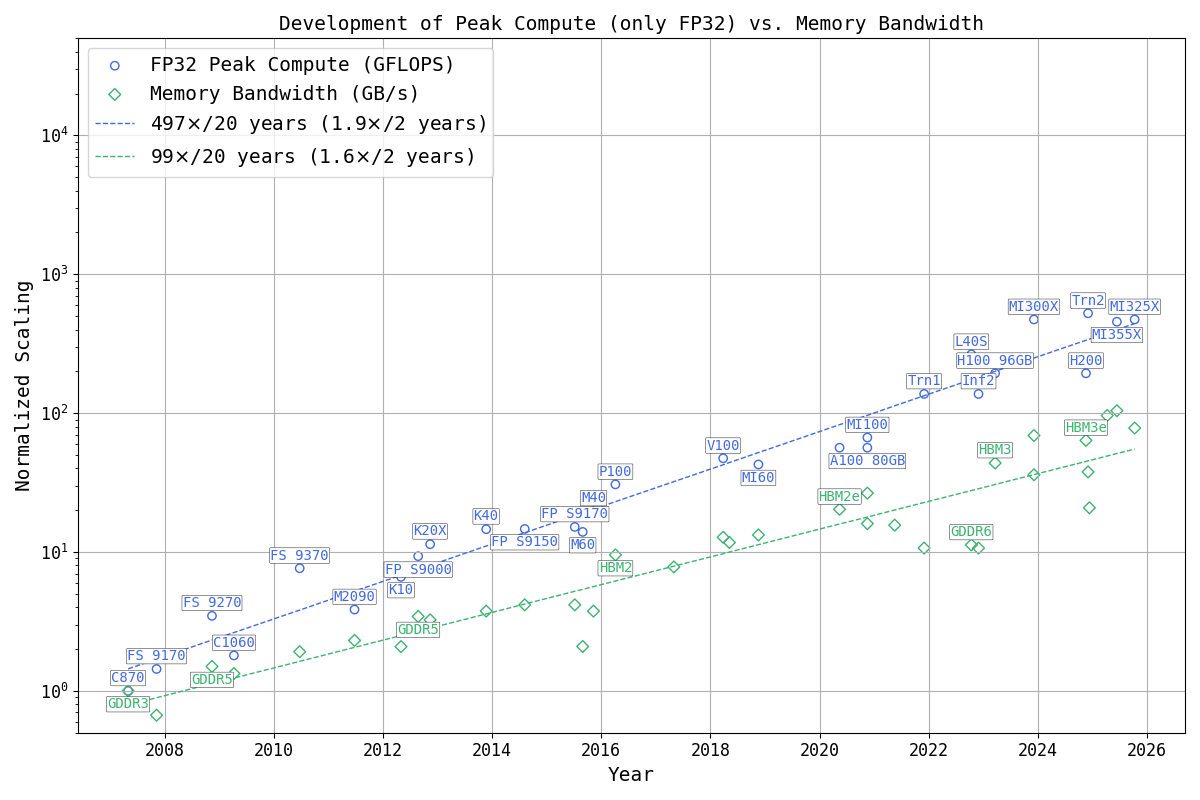
The second figure shows the same axes and scaling, but restricts the data strictly to FP32 performance.
This view highlights how the memory wall already existed before the introduction of low-precision datatypes and sparsity, and helps disentangle architectural scaling effects from numerical format innovations.
Contributions, corrections, and extensions are very welcome.